
Lesson overview
data presentation and GIS appears across GCSE Geography specifications through physical geography, human geography, geographical skills, fieldwork or issue evaluation.
Use the notes on this page first. They give the terms, processes, evidence types and answer routines needed to practise data presentation and GIS without leaving the lesson.
What you will learn
- Explain data presentation and GIS using accurate geographical vocabulary.
- Use place, scale and evidence rather than vague general statements.
- Interpret maps, graphs, photographs or data where the topic needs them.
- Write concise GCSE answers with clear cause, effect and judgement.
Core knowledge
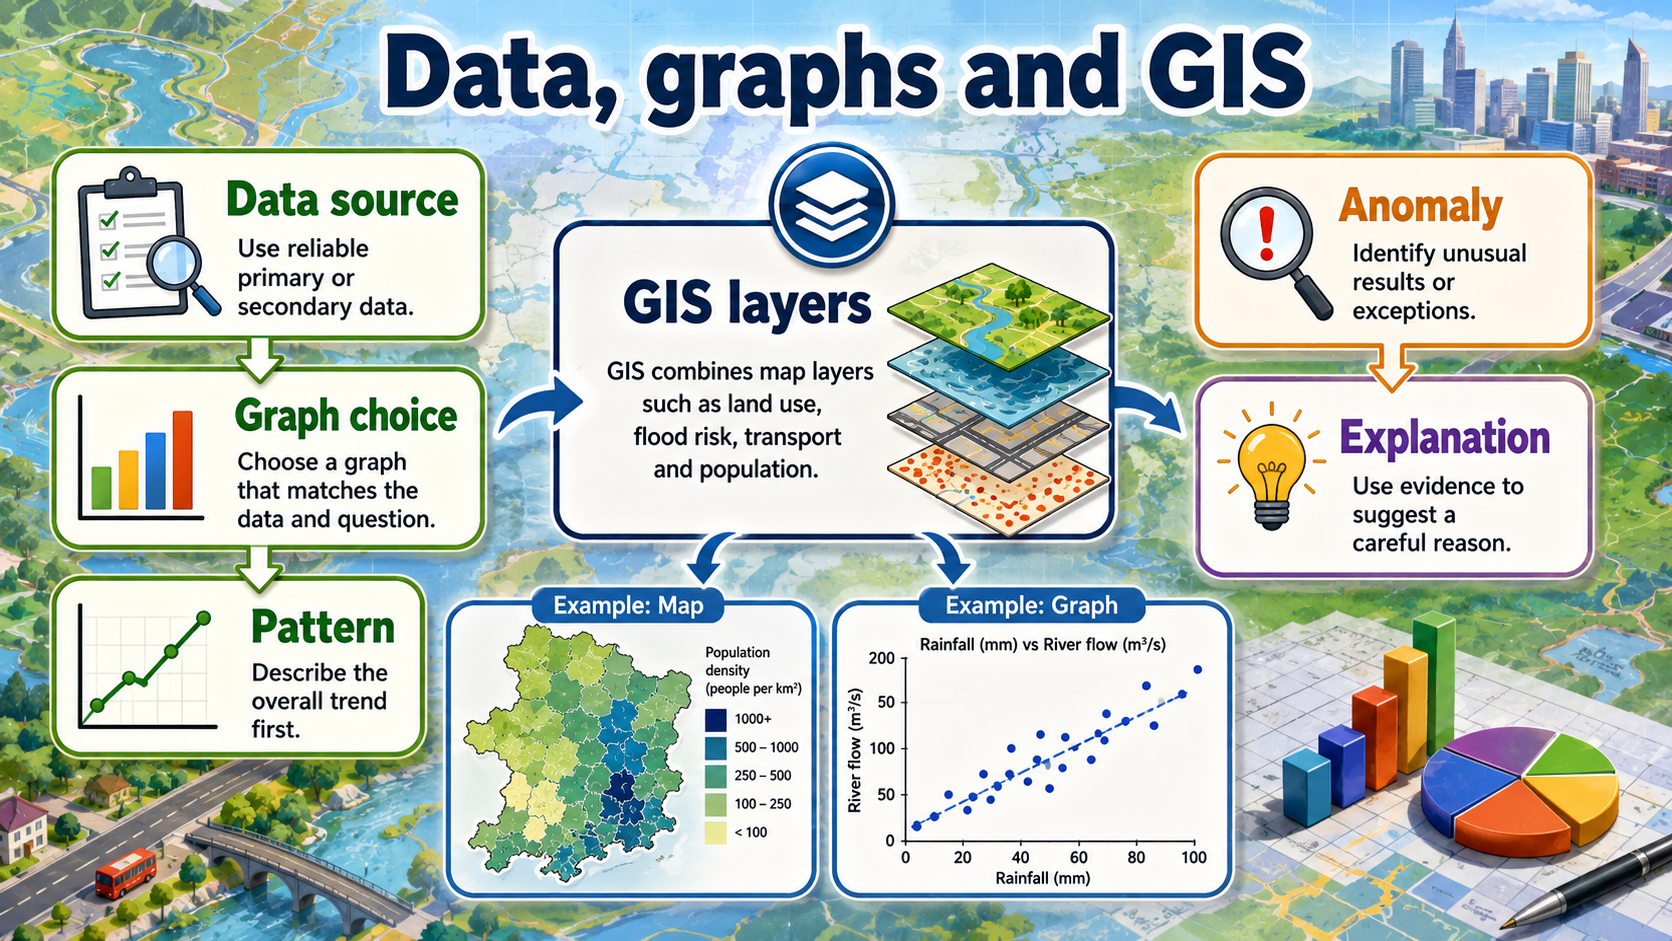
- Main idea: Use graphs, maps, GIS layers and statistics to describe patterns and anomalies.
- Useful evidence includes choropleth maps, line graphs, scatter graphs, GIS layers.
- Geographical data can be primary, collected through fieldwork, or secondary, collected by someone else.
- Line graphs are useful for change over time. Bar charts compare categories. Scatter graphs test relationships.
- Choropleth maps shade areas to show data values, but they can hide variation inside each area.
- GIS combines map layers, such as population, flood risk, transport and land use, to help analyse spatial patterns.
- A strong data description gives an overall trend, specific evidence, exceptions and a cautious explanation.
- Statistics such as mean, range and percentage change help make comparisons precise.
Data and GIS: study route
Use this as a reading route, not as a diagram to memorise.
- Data source
- Graph choice
- Pattern
- Exception
- Explanation
Data, graphs and GIS infographic
Self-contained notes and practice
Use the notes on this page first. They give the terms, processes, evidence types and answer routines needed to practise data presentation and GIS without leaving the lesson.
Explanation
A strong geography answer on data presentation and GIS starts with a precise process or pattern, then adds place, scale and evidence. The answer should explain cause and effect rather than listing disconnected facts.
When using resources, describe what the evidence shows first, then infer carefully. If the question asks for a decision, weigh benefits, costs, risks and sustainability before reaching a judgement.
Worked examples
Explaining GIS
Question: Explain how GIS helps a geographer understand graph choice in data presentation and GIS.
Method: Start with GIS, use choropleth maps, then explain the link to graph choice.
Reveal answer and marking guidance
Geographical data can be primary, collected through fieldwork, or secondary, collected by someone else. A strong answer would use choropleth maps to show the pattern or process, then explain how this changes graph choice in data presentation and GIS.
Judging explanation
Question: A student says that explanation is the main issue in Data and GIS. What evidence would make that judgement convincing?
Method: Use choropleth, line graphs and one clear impact or management point before making the judgement.
Reveal answer and marking guidance
A convincing judgement would use choropleth and evidence such as line graphs. It should explain why explanation matters for data presentation and GIS, then weigh it against another part of the lesson such as graph choice.
Quick checks
Choose an answer, then check your thinking.
1. For Data and GIS, which evidence would best support an answer about data presentation and GIS?
2. For Data and GIS, what should a student explain after naming GIS?
Practice
Question 1
For Data and GIS, write a two-step process chain linking GIS to graph choice.
Reveal answer and marking guidance
Answer: A strong chain starts with GIS, uses choropleth maps, and explains how it changes graph choice in data presentation and GIS.
Marking: Credit accurate use of GIS, choropleth maps and a clear cause-effect link.
Question 2
Use line graphs to describe what a geographer should notice about data presentation and GIS.
Reveal answer and marking guidance
Answer: The answer should describe a visible or measurable pattern in line graphs, then use terms such as choropleth and scatter graph.
Marking: Credit a precise description of line graphs; do not credit a vague description with no evidence.
Question 3
Explain why pattern changes the answer a student should give about Data and GIS.
Reveal answer and marking guidance
Answer: Pattern changes the answer because it adds a specific part of the process or issue. Useful evidence includes scatter graphs, alongside the lesson note: Line graphs are useful for change over time. Bar charts compare categories. Scatter graphs test relationships.
Marking: Credit explanation that links pattern to data presentation and GIS with evidence.
Question 4
Make a justified decision about whether explanation is the most important part of data presentation and GIS.
Reveal answer and marking guidance
Answer: A justified decision should weigh explanation against graph choice, using evidence such as choropleth maps and line graphs. One useful lesson detail is: GIS combines map layers, such as population, flood risk, transport and land use, to help analyse spatial patterns.
Marking: Credit a balanced judgement with evidence from Data and GIS, not a one-sentence opinion.
Exam ladder
- Describe the pattern or process using precise vocabulary.
- Add map, graph, data, photograph or case-study evidence.
- Explain cause and effect using place and scale.
- Reach a judgement when the question asks you to assess, evaluate or decide.
Answers and marking guidance
The exact practice answers are hidden under each question so you can try first. Marks come from accurate geography, evidence from maps or data where useful, clear cause-and-effect language, and a judgement that follows from the evidence.
Common mistakes
- Using a place name without explaining the process.
- Describing a graph or map without quoting any evidence.
- Writing a one-sided judgement when the question needs balance.
- Mixing up cause, impact, response and evaluation.
Extension
Create a one-page revision sheet for data presentation and GIS with five key terms, three evidence types, one process chain and two exam-style judgement sentences.
Exam-board guidance
Short board notes only. Learn the core geography above first.
AQA GCSE Geography
AQA GCSE Geography students should use this lesson for data presentation and GIS, then match the final case-study detail and question style to the route taught by their school.
OCR GCSE Geography A
OCR GCSE Geography A students should use this lesson for data presentation and GIS, then match the final case-study detail and question style to the route taught by their school.
OCR GCSE Geography B
OCR GCSE Geography B students should use this lesson for data presentation and GIS, then match the final case-study detail and question style to the route taught by their school.
Pearson Edexcel GCSE Geography A
Pearson Edexcel GCSE Geography A students should use this lesson for data presentation and GIS, then match the final case-study detail and question style to the route taught by their school.
Pearson Edexcel GCSE Geography B
Pearson Edexcel GCSE Geography B students should use this lesson for data presentation and GIS, then match the final case-study detail and question style to the route taught by their school.
Eduqas GCSE Geography A
Eduqas GCSE Geography A students should use this lesson for data presentation and GIS, then match the final case-study detail and question style to the route taught by their school.
Eduqas GCSE Geography B
Eduqas GCSE Geography B students should use this lesson for data presentation and GIS, then match the final case-study detail and question style to the route taught by their school.
WJEC Wales GCSE Geography
WJEC Wales GCSE Geography students should use this lesson for data presentation and GIS, then match the final case-study detail and question style to the route taught by their school.
CCEA GCSE Geography
CCEA GCSE Geography students should use this lesson for data presentation and GIS, then match the final case-study detail and question style to the route taught by their school.