
Lesson overview
A key algebra graph topic.
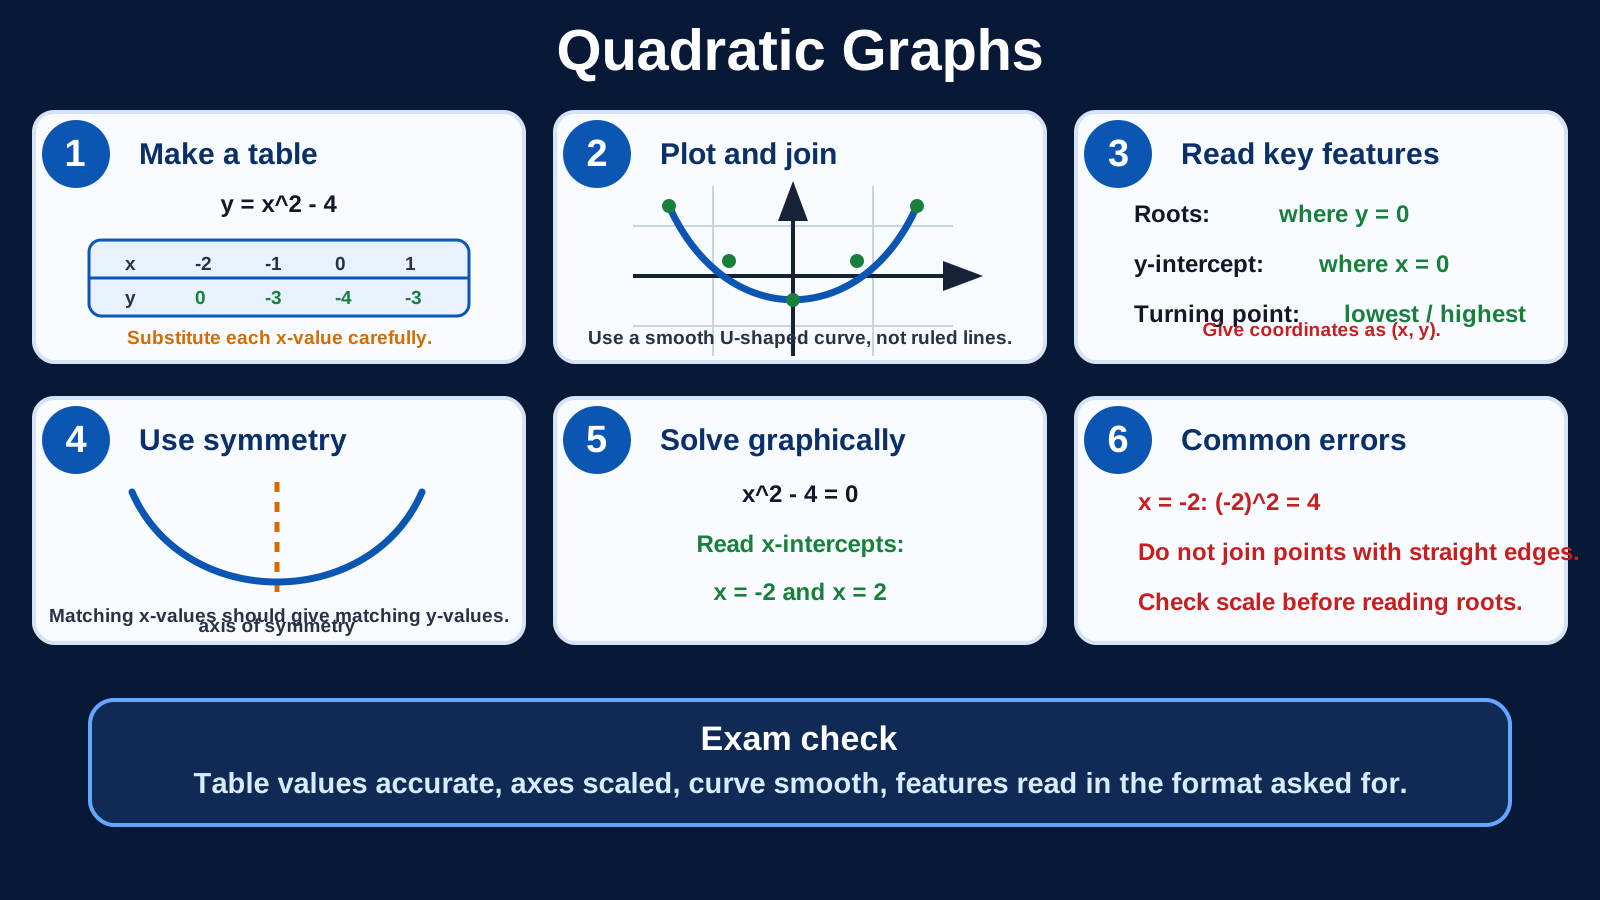
Quadratic graphs are curved graphs such as y = x² − 4. GCSE questions may ask you to complete a table of values, draw the curve, read roots, find intercepts or turning points, or solve an equation using the graph.
What you will learn
Key facts before you start
Quadratic graphs infographic
Before viewing
Before viewing, identify the roots, intercept and turning point on the graph.
After viewing
After viewing, match one quadratic graph feature to an algebraic feature of the equation.
Why this matters
Quadratic graphs turn algebra into a picture. The roots show where the expression equals zero, the y-intercept shows the value when x = 0, and the turning point shows the lowest or highest point of the curve.
This skill supports later work on functions, transformations, simultaneous equations with curves and real-life graph interpretation.
Prior knowledge
You should already be comfortable with:
Clear explanation
Quadratic graphs are curves
A quadratic graph has an x² term. The simplest one, y = x², is a U-shaped curve. If the x² coefficient is positive, the curve opens upwards. If it is negative, the curve opens downwards.
Use a table of values
To draw a quadratic graph, substitute chosen x-values into the equation. For y = x² − 4:
Roots are where the curve meets the x-axis
When the graph crosses the x-axis, y = 0. So the roots of y = x² − 4 are the same as the solutions to x² − 4 = 0.
Worked examples
Example 1: Complete a table
Complete the table for y = x² + 1 when x = −2, −1, 0, 1 and 2.
When x = −2, y = (−2)² + 1 = 5. The y-values are 5, 2, 1, 2, 5.Reveal answer
Answer: (−2, 5), (−1, 2), (0, 1), (1, 2), (2, 5).
Example 2: Read the y-intercept
What is the y-intercept of y = x² − 3x + 2?
The y-intercept happens when x = 0. y = 0² − 3 × 0 + 2 = 2Reveal answer
Answer: the y-intercept is 2, at the point (0, 2).
Example 3: Find roots from factors
Find where y = x² − 5x + 6 crosses the x-axis.
x² − 5x + 6 = (x − 2)(x − 3) Set y = 0, so (x − 2)(x − 3) = 0.Reveal answer
Answer: the graph crosses at x = 2 and x = 3.
Example 4: Use symmetry
The graph y = x² − 4 has roots −2 and 2. What is the x-coordinate of its turning point?
The turning point is halfway between the roots. Halfway between −2 and 2 is 0.Reveal answer
Answer: x = 0.
Quick checks
Choose an answer, then check your thinking.
1. What shape is the graph of y = x²?
2. For y = x² − 1, what is y when x = 3?
3. What does an x-axis crossing show?
Practice questions
Question 1
Complete the table for y = x² − 2 when x = −2, −1, 0, 1 and 2.
Reveal answer and marking guidance
Answer: y-values are 2, −1, −2, −1, 2, so the coordinates are (−2, 2), (−1, −1), (0, −2), (1, −1), (2, 2).
Marking: Square each x-value before subtracting 2; remember (−2)² = 4 and (−1)² = 1.
Question 2
For y = x² − 4x + 3, find the y-intercept.
Reveal answer and marking guidance
Answer: the y-intercept is 3, at (0, 3).
Marking: Substitute x = 0 into the equation: 0² − 4 × 0 + 3 = 3.
Question 3
The graph y = x² − 9 crosses the x-axis at two points. Find the x-values.
Reveal answer and marking guidance
Answer: x = −3 and x = 3.
Marking: Set y = 0, so x² − 9 = 0. Then x² = 9, giving both positive and negative roots.
Question 4
Find the roots of y = x² − 7x + 10.
Reveal answer and marking guidance
Answer: x = 2 and x = 5.
Marking: Factorise x² − 7x + 10 as (x − 2)(x − 5), then set each bracket equal to zero.
Question 5
The roots of a quadratic graph are x = −1 and x = 5. What is the x-coordinate of the turning point if the graph is symmetrical?
Reveal answer and marking guidance
Answer: x = 2.
Marking: Find the midpoint of −1 and 5: (−1 + 5) ÷ 2 = 2.
Question 6
Use the table x: −2, −1, 0, 1, 2 and y: 6, 1, −2, −3, −2. What is the turning point shown by these values?
Reveal answer and marking guidance
Answer: (1, −3).
Marking: The turning point is the lowest y-value in the table, paired with its x-value.
Question 7
For y = −x² + 4x + 5, find the y-intercept and state whether the graph opens upwards or downwards.
Reveal answer and marking guidance
Answer: The y-intercept is 5, at (0, 5), and the graph opens downwards.
Marking: Substitute x = 0 to find the y-intercept. The negative coefficient of x² means the curve opens downwards.
Question 8
A quadratic graph has roots x = −2 and x = 6, and it opens upwards. What is the x-coordinate of its turning point?
Reveal answer and marking guidance
Answer: x = 2.
Marking: Use symmetry: the turning point is halfway between the roots, so (−2 + 6) ÷ 2 = 2.
Question 9
A quadratic graph opens upwards, crosses the x-axis at x = −1 and x = 4, and crosses the y-axis at −4. Write a possible equation for the graph.
Reveal answer and marking guidance
Answer: y = x² − 3x − 4.
Marking: The roots give y = k(x + 1)(x − 4). The y-intercept is −4, so −4k = −4 and k = 1. Expanding gives y = x² − 3x − 4.
Question 10
A quadratic graph has roots x = −3 and x = 1. It passes through the point (2, 10). Write an equation for the graph in expanded form.
Reveal answer and marking guidance
Answer: y = 2x² + 4x − 6.
Marking: The roots give y = k(x + 3)(x − 1). Substitute (2, 10): 10 = k × 5 × 1, so k = 2. Then y = 2(x + 3)(x − 1) = 2x² + 4x − 6.
Answers and marking guidance
The exact practice answers are hidden under each question so you can try first. For quadratic graph questions, marks usually come from substituting values accurately, using a sensible scale, plotting points precisely, drawing a smooth curve rather than joining with straight segments, and reading roots, intercepts and turning points from the correct axis or coordinate pair. When building an equation from a graph, use the roots as bracket factors and check the y-intercept before expanding.
Common mistakes
- Forgetting to square negatives: (−3)² is 9, not −9.
- Joining points with straight lines: a quadratic graph should be a smooth curve.
- Using too few points: plot enough points near the turning point to show the shape.
- Mixing up intercepts: x-intercepts are roots; the y-intercept happens when x = 0.
- Reading the wrong coordinate: a root is an x-value, not the whole coordinate unless the question asks for the point.
Extension challenge
The graph y = x² − 6x + 5 crosses the x-axis at x = 1 and x = 5. Find the coordinates of its turning point.
Reveal answer
Answer: (3, −4).
The x-coordinate is halfway between the roots: (1 + 5) ÷ 2 = 3. Substitute x = 3: y = 3² − 6 × 3 + 5 = 9 − 18 + 5 = −4.
Exam-board guidance
Quadratic graphs are assessed by every GCSE Maths board. Questions may ask you to complete tables, draw curves, read roots, identify intercepts, describe turning points or solve equations graphically.
AQA GCSE Maths
Focus on the shared method, notation and checking habit; wording and context can vary by route.
OCR GCSE Maths
Show clear method steps and use precise notation; question wording may vary by route.
Pearson Edexcel GCSE Maths
Keep working visible and check units or notation; contexts may vary by route.
Eduqas GCSE Maths
Use the same core skill in practical contexts, with clear reasoning and final checks.
WJEC Wales
Connect the method to the context and state what the result means.
CCEA GCSE Maths
Make each method step visible and keep notation, units and final checks clear.
Next lesson
Next, build on graph and algebra work with Functions and Composite/Inverse Functions.