
Forces
Lesson overview
This lesson introduces the core physics idea, the useful equipment and the calculation or data skills used on this page.
What you will learn
Graph descriptions supplied on this page
Use the journey and trolley graph descriptions to practise gradient, area and motion language.
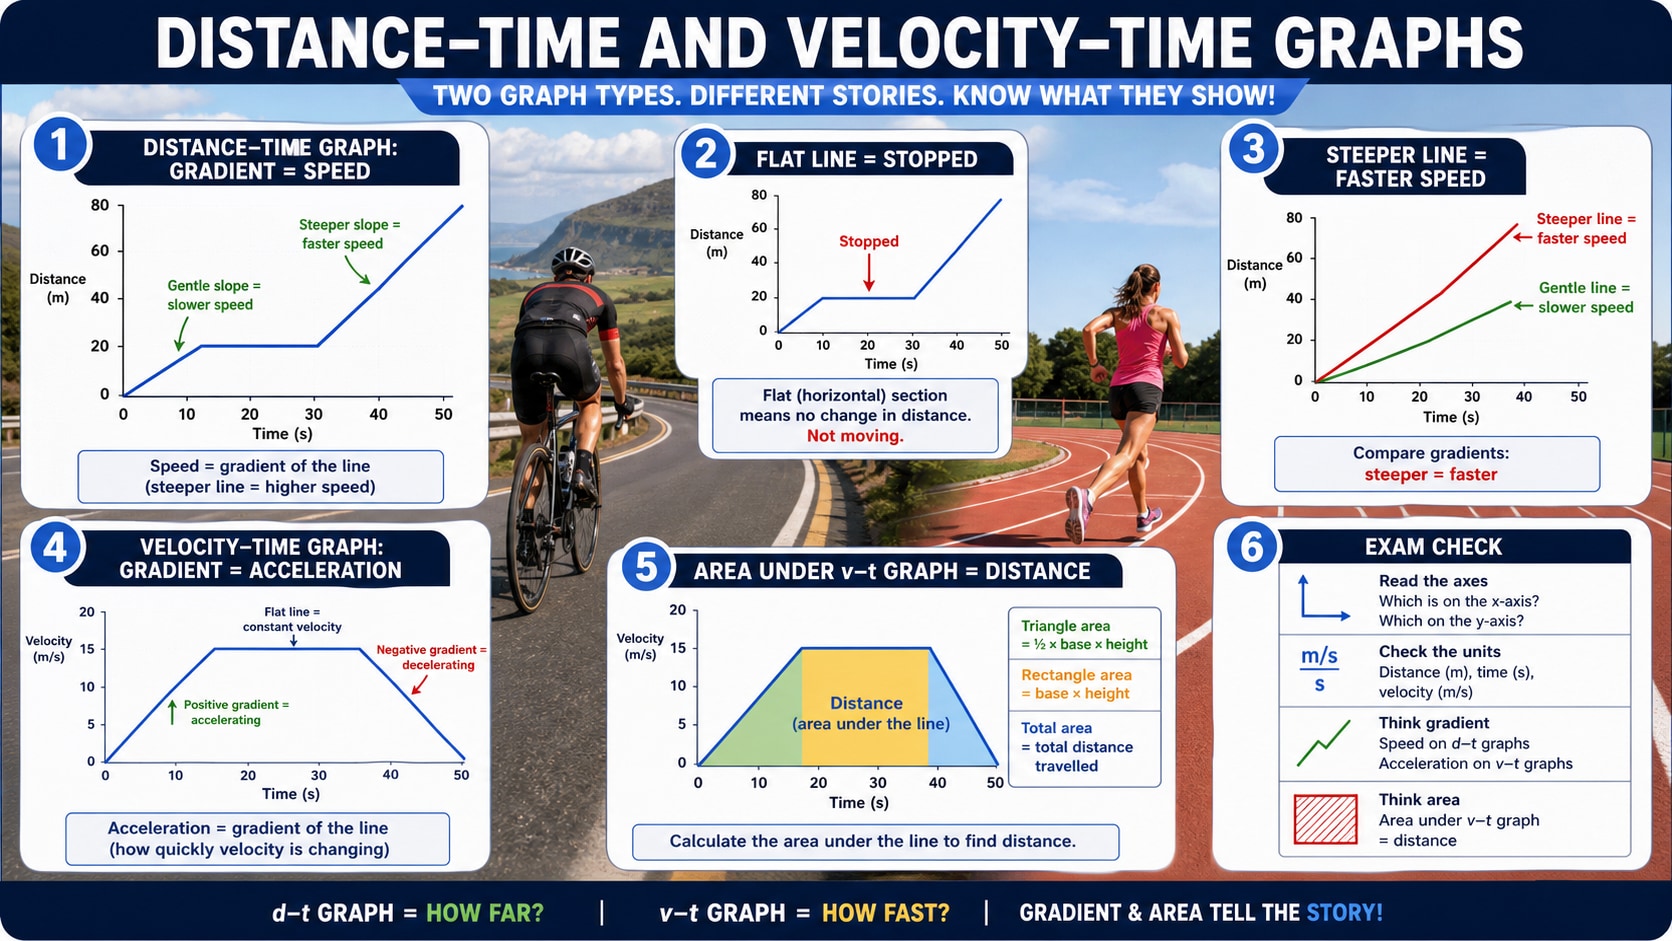
Distance-time and velocity-time graphs infographic
Clear explanation
On a distance-time graph, gradient represents speed. A steeper line means a greater speed; a horizontal line means stationary.
On a velocity-time graph, gradient represents acceleration. The area under the graph represents distance travelled.
Graph questions reward method: mark two clear points for gradient and split areas into rectangles and triangles when needed.
Key graph
Worked examples
Distance from a velocity-time graph
A car travels at 12 m/s for 5 s.
distance = area under velocity-time graph
area = 12 x 5 = 60
Quick checks
Choose an answer, then check your thinking.
1. What does the gradient of a distance-time graph represent?
2. What does the area under a velocity-time graph represent?
Practice questions
Question 1
A distance-time graph rises from 0 m to 40 m in 8 s. Calculate speed.
Reveal answer and marking guidance
Answer: 5 m/s.
Marking: Credit gradient = 40 ÷ 8 = 5 m/s.
Question 2
A velocity-time graph is horizontal at 6 m/s for 10 s. Calculate distance.
Reveal answer and marking guidance
Answer: 60 m.
Marking: Credit area = 6 x 10 = 60 m.
Question 3
A velocity changes from 2 m/s to 14 m/s in 6 s. Calculate acceleration.
Reveal answer and marking guidance
Answer: 2 m/s².
Marking: Credit gradient = change in velocity ÷ time = 12 ÷ 6 = 2 m/s².
Question 4
What does a horizontal line on a distance-time graph mean?
Reveal answer and marking guidance
Answer: The object is stationary.
Marking: Credit distance not changing as time passes.
Practice ladder
Answers and marking guidance
The exact practice answers are hidden under each question so you can try first. For this lesson, marks come from using the correct physics model, choosing the right equation where needed, keeping units with values, and explaining changes with precise words such as transfer, resultant force, acceleration, evidence and uncertainty.
Common mistakes
- Confusing distance-time and velocity-time gradients.
- Using the whole graph as one shape when it needs splitting.
- Calling a flat distance-time graph constant speed.
- Forgetting graph units.
Extension challenge
Sketch a velocity-time graph with acceleration, steady speed and deceleration, then calculate a possible total distance.
Reveal answer
Example answer: A strong extension response names the physics model, uses accurate units and explains why the evidence supports the conclusion.
Exam-board guidance
Short board notes only. Learn the core physics above first.
AQA GCSE Physics
AQA GCSE Physics: often rewards clear physics explanations, correct equations, units and practical evidence for distance-time and velocity-time graphs.
OCR GCSE Physics
OCR GCSE Physics: often values precise definitions, clear working, graph interpretation and links between models and evidence.
Pearson Edexcel GCSE Physics
Pearson Edexcel GCSE Physics: often combines the concept with equation use, data handling and practical interpretation.
Eduqas GCSE Physics
Eduqas GCSE Physics: learn the core explanation and practise applying it to unfamiliar contexts, data and practical questions.
WJEC Wales
WJEC Wales: often expects accurate terms, units and evidence-based explanations using the shared physics idea.
CCEA GCSE Physics
CCEA GCSE Physics: connect the idea to your current unit and use the same practical method language your class uses.
Next lesson
Next, continue with Newton's Laws and Resultant Forces.