
Practical skills
Lesson overview
This lesson introduces the core biology idea, the useful equipment and the calculation or data skills used on this page.
What you will learn
Core knowledge
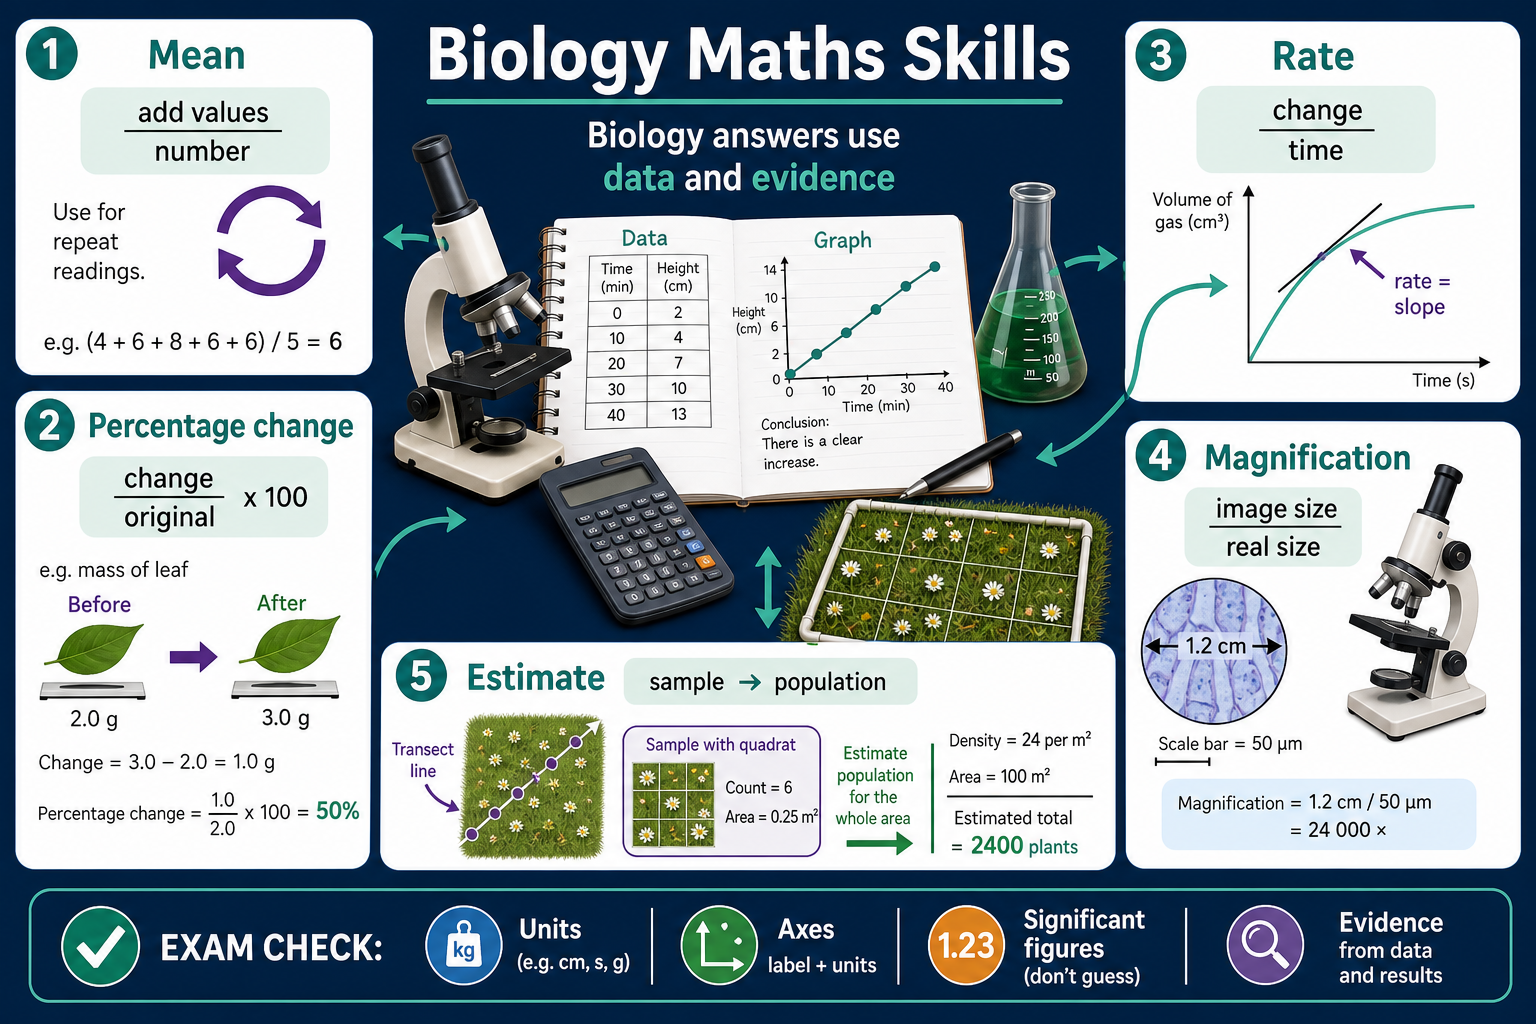
Biology maths skills infographic
Biology Maths practice set
Use the worked examples and practice questions on this page as a complete study task: learn the definitions of mean and percentage change, summarise the infographic in your own words, then answer the questions using the data, equations and observations given here. Check every answer for rates, percentages, means, estimates, magnification and graph gradients.
Clear explanation
First secure the anchor idea: biology maths, graphs and sampling skills. In ordinary language, this means using mean, percentage change and rate to explain what is happening, not just spotting those words in the question.
Next look for the evidence. In this lesson it is likely to come from means, percentages, rates, estimates, graph gradients, magnification calculations and sampling data.
Then build the answer in order: Choose the right calculation then keep units with values then use graph gradients, means or estimates to support the conclusion. This stops the answer becoming a list of disconnected facts.
If the question includes data, use rates, percentages, means, estimates, magnification and graph gradients. Keep the unit or comparison visible, then link the result back to mean or percentage change.
Exam-ready model sentence: The calculation supports the conclusion because the processed value shows the size or direction of the biological change.
Worked examples
Biology Maths: from idea to explanation
Question: Explain biology maths, graphs and sampling skills using the model.
Start with the idea: Choose the right calculation.
Add the mechanism: keep units with values.
Finish with the consequence: use graph gradients, means or estimates to support the conclusion.
Reveal worked answer
Answer: A good answer uses mean (a calculated average found by adding values and dividing by the number of values), percentage change (a way to compare a change with the starting value) and rate (how much something changes per unit time) in one connected explanation. For example: The calculation supports the conclusion because the processed value shows the size or direction of the biological change.
Biology Maths: from evidence to marks
Question: A student has evidence from means, percentages, rates, estimates, graph gradients, magnification calculations and sampling data. What should their answer include?
Step 1: name the useful evidence rather than writing a general fact about the topic.
Step 2: process any data with rates, percentages, means, estimates, magnification and graph gradients.
Step 3: explain what the evidence shows about mean and percentage change.
Reveal worked answer
Answer: The answer earns marks by joining evidence, method or data to a biological reason. Avoid listing apparatus without explaining variables, reliability, uncertainty or how the data supports the conclusion.
Quick checks
Choose an answer, then check your thinking.
1. Which answer would make biology maths clearer?
2. What should you check before finishing an answer on this lesson?
Practice questions
Question 1
Define mean and use it in a complete sentence about biology maths, graphs and sampling skills.
Reveal answer and marking guidance
Answer: Mean means a calculated average found by adding values and dividing by the number of values. In biology maths, graphs and sampling skills, it helps explain choose the right calculation.
Marking: Credit the definition and a sentence that uses the term in the lesson context.
Question 2
Explain the main sequence in Biology Maths using the infographic.
Reveal answer and marking guidance
Answer: Choose the right calculation -> Keep units with values -> Use graph gradients, means or estimates to support the conclusion. A strong answer says why the final step follows from the first two steps.
Marking: Credit the correct order plus a biological link between the steps.
Question 3
A question gives evidence such as means, percentages, rates, estimates, graph gradients, magnification calculations and sampling data. What should you do with that evidence?
Reveal answer and marking guidance
Answer: Identify the useful observation, method detail or data first. Then use rates, percentages, means, estimates, magnification and graph gradients where relevant and explain what it shows about mean, percentage change or rate.
Marking: Credit evidence use, relevant data handling and a clear biology explanation.
Question 4
A student writes: 'mean is involved, so the answer is correct.' What detail is missing?
Reveal answer and marking guidance
Answer: Mean means a calculated average found by adding values and dividing by the number of values. A better answer also uses percentage change (a way to compare a change with the starting value) and explains the evidence route: Choose the right calculation then keep units with values. An exam-ready version could be: The calculation supports the conclusion because the processed value shows the size or direction of the biological change.
Marking: Credit a precise definition, a second linked term and use of evidence or model steps.
Practice ladder
Answers and marking guidance
The exact practice answers are hidden under each question so you can try first. Marks come from using the correct biology model, choosing the right calculation where needed, keeping units with values, labelling diagrams clearly, and explaining changes with precise words such as cells, enzymes, hormones, genes, adaptation, rate, evidence and uncertainty.
Common mistakes
- Using mean, percentage change or rate as labels without explaining what they mean.
- Forgetting to connect the answer to likely evidence, such as means, percentages, rates, estimates, graph gradients, magnification calculations and sampling data.
- Missing the maths or data habit: rates, percentages, means, estimates, magnification and graph gradients.
- Falling into the common trap of listing apparatus without explaining variables, reliability, uncertainty or how the data supports the conclusion.
Extension challenge
Create a focused revision card for biology maths, graphs and sampling skills: three exact definitions, one model sequence, one evidence detail such as means, percentages, rates, estimates, graph gradients, magnification calculations and sampling data, one data check using rates, percentages, means, estimates, magnification and graph gradients, one common misconception, and one exam-ready explanation sentence: The calculation supports the conclusion because the processed value shows the size or direction of the biological change.
Reveal answer
Example answer: A complete response names the biology model, uses accurate units or observations, and explains why the evidence supports the conclusion.
Exam-board guidance
Short board notes only. Learn the core biology above first.
AQA GCSE Biology
Often links this topic to practical skills through mean and percentage change. Question wording and depth can vary by board.
OCR GCSE Biology
Often links this topic to practical skills through mean and percentage change. Question wording and depth can vary by board.
Pearson Edexcel GCSE Biology
Often links this topic to practical skills through mean and percentage change. Question wording and depth can vary by board.
Eduqas GCSE Biology
Often links this topic to practical skills through mean and percentage change. Question wording and depth can vary by board.
WJEC Wales
Often links this topic to practical skills through mean and percentage change. Question wording and depth can vary by board.
CCEA GCSE Biology
Often links this topic to practical skills through mean and percentage change. Question wording and depth can vary by board.
Next lesson
Next, continue with Microscopy practical method.