
Lesson overview
Histograms is part of GCSE Maths Statistics.
Use frequency density to draw and read histograms with unequal class widths. Questions may ask you to calculate densities, draw bars accurately, find missing frequencies from area, or explain why a histogram is not the same as a bar chart.
What you will learn
Key facts before you start
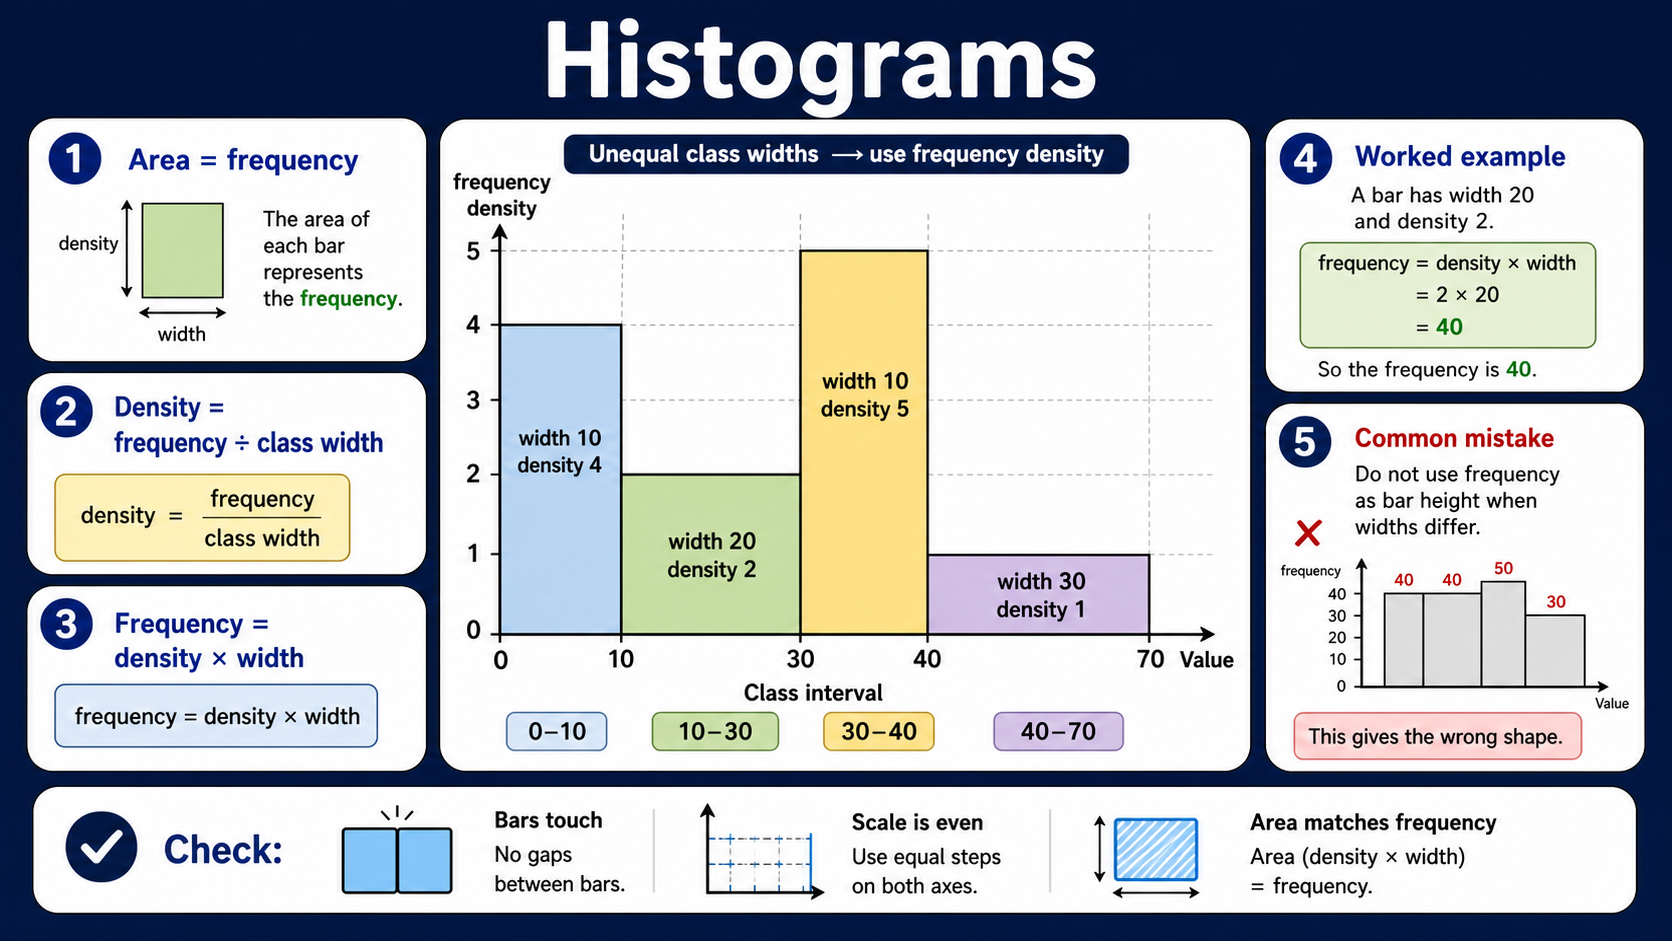
Histograms infographic
Before viewing
Before viewing, identify one class width and its frequency density.
After viewing
After viewing, calculate a missing frequency from a histogram bar.
Why this matters
Histograms let you display grouped continuous data when class widths are not all equal. The key GCSE idea is that frequency is shown by area, so a wider bar can represent many values even when it is not very tall.
Prior knowledge
You should already be comfortable with:
Clear explanation
Main idea
In a histogram, the area of each bar represents the frequency. The height is called frequency density.
Method
Find each class width, calculate frequency density for each row, choose a sensible vertical scale, then draw each bar across its whole class interval with no gaps between neighbouring intervals.
When you read from a completed histogram, check the horizontal width of the interval and the vertical density scale separately. If only part of a bar is needed, use the same area idea for that part of the interval, so an estimate from 20 to 25 uses width 5 multiplied by the bar's density.
Answer tip
Do not draw ordinary frequency bars when the widths are unequal. If the question asks for a missing frequency, use the rectangle area: width × density.
Worked examples
Finding frequency density
A class interval 20 ≤ x < 35 has frequency 45. Find the frequency density.
Reveal answer
Answer: The frequency density is 3.
Finding a missing frequency
A histogram bar covers 40 ≤ x < 60 and has frequency density 1.8. Find the frequency represented by the bar.
Reveal answer
Answer: The frequency is 36.
Estimating part of a bar
In a histogram, the interval 10 ≤ x < 30 has frequency density 2.5. Estimate how many values are between 10 and 18, assuming the data is evenly spread within the class.
Reveal answer
Answer: About 20 values.
Quick checks
Choose an answer, then check your thinking.
1. What represents frequency in a histogram?
2. A class has frequency 24 and width 6. What is its frequency density?
Practice questions
Question 1
A teacher groups pupils' journey times using the class 10 ≤ x < 18 minutes. The frequency is 20. Find the class width and frequency density.
Reveal answer and marking guidance
Answer: Class width 8; frequency density 2.5.
Marking: Width = 18 − 10 = 8, then density = 20 ÷ 8 = 2.5.
Question 2
A histogram for parcel masses has a bar covering 30 ≤ x < 50 kg with frequency density 1.6. Find the frequency represented by this bar.
Reveal answer and marking guidance
Answer: 32.
Marking: Width = 20, so frequency = 1.6 × 20 = 32.
Question 3
A grouped table for reaction times has class 0 ≤ x < 5 with frequency 12 and class 5 ≤ x < 20 with frequency 30. Find both frequency densities before drawing the histogram.
Reveal answer and marking guidance
Answer: 2.4 and 2.
Marking: First density = 12 ÷ 5 = 2.4. Second density = 30 ÷ 15 = 2.
Question 4
In a histogram comparing running times, one class interval is twice as wide as another. Explain why the wider interval does not automatically need a bar twice as tall.
Reveal answer and marking guidance
Answer: In a histogram, frequency is shown by area, so the height depends on frequency density, not frequency alone.
Marking: Mention area and frequency density. A wider interval can have a lower height if its frequency is spread over a larger width.
Question 5
A table of plant heights has interval 20 ≤ x < 30 cm with frequency 18 and interval 30 ≤ x < 55 cm with frequency 40. Find the two frequency densities.
Reveal answer and marking guidance
Answer: 1.8 and 1.6.
Marking: Widths are 10 and 25, so densities are 18 ÷ 10 = 1.8 and 40 ÷ 25 = 1.6.
Question 6
On a histogram, the interval 60 ≤ x < 75 has frequency density 2.4. The interval 75 ≤ x < 95 has frequency density 1.5. Which interval contains more values, and by how many?
Reveal answer and marking guidance
Answer: The interval 60 ≤ x < 75 contains 6 more values.
Marking: First frequency = 15 × 2.4 = 36. Second frequency = 20 × 1.5 = 30. Compare the areas, not just the heights.
Question 7
A histogram has a bar for 12 ≤ x < 20 with frequency density 3.25. Find the frequency in this class.
Reveal answer and marking guidance
Answer: 26.
Marking: Width = 20 − 12 = 8, so frequency = 8 × 3.25 = 26.
Question 8
The interval 0 ≤ x < 10 has frequency 35. The interval 10 ≤ x < 25 has frequency 45. Which bar is taller on the histogram, and why?
Reveal answer and marking guidance
Answer: The 0 ≤ x < 10 bar is taller.
Marking: Its density is 35 ÷ 10 = 3.5. The second density is 45 ÷ 15 = 3, so the first bar has the greater height even though it has fewer total values.
Question 9
In a histogram, the interval 50 ≤ x < 80 has frequency density 1.2. Estimate the number of values from 50 to 65, assuming the values are evenly spread within the class.
Reveal answer and marking guidance
Answer: About 18 values.
Marking: Partial width = 65 − 50 = 15, so estimated frequency = 15 × 1.2 = 18.
Question 10
A histogram has intervals 0 ≤ x < 20, 20 ≤ x < 30 and 30 ≤ x < 50. Their frequency densities are 1.4, 3.6 and 0.9. Find the total frequency represented.
Reveal answer and marking guidance
Answer: 82.
Marking: Use area for each bar: 20 × 1.4 = 28, 10 × 3.6 = 36, and 20 × 0.9 = 18. The total frequency is 28 + 36 + 18 = 82.
Answers and marking guidance
The exact practice answers are hidden under each question so you can try first. For histograms, marks usually come from calculating class widths accurately, using frequency density rather than raw frequency for bar heights, drawing bars to the correct scale, and using rectangle area to recover missing frequencies. In explanations, state clearly that area represents frequency.
Common mistakes
- Using frequency as height: this only works like a bar chart when all widths are equal, and GCSE histogram questions often use unequal widths.
- Forgetting class width: always subtract lower boundary from upper boundary before finding density.
- Leaving gaps between touching intervals: histograms for continuous grouped data usually have adjacent bars touching.
- Reading height as frequency: multiply density by width when the question asks how many values are in a class.
Extension challenge
Create a grouped frequency table with unequal class widths, draw the matching histogram, then write one sentence explaining how a reader can check one bar's frequency from its area.
Reveal answer
Example answer: A good response includes class widths, frequency densities, accurately scaled bars and one check such as width 15 × density 2 = frequency 30.
Exam-board guidance
Histograms appears within GCSE Maths statistics where pupils draw and interpret grouped-data diagrams. The shared skill is to use frequency density for unequal class widths and to remember that bar area, not height alone, represents frequency.
AQA GCSE Maths
Focus on the shared method, notation and checking habit; wording and context can vary by route.
OCR GCSE Maths
Show clear method steps and use precise notation; question wording may vary by route.
Pearson Edexcel GCSE Maths
Keep working visible and check units or notation; contexts may vary by route.
Eduqas GCSE Maths
Use the same core skill in practical contexts, with clear reasoning and final checks.
WJEC Wales
Connect the method to the context and state what the result means.
CCEA GCSE Maths
Make each method step visible and keep notation, units and final checks clear.
Next lesson
This completes the currently planned GCSE Maths lesson roadmap.