
Lesson overview
Averages and Range is part of GCSE Maths Statistics.
Find and compare mean, median, mode and range, including from tables. Questions may ask for calculations, estimates from grouped data or a written comparison of typical value and spread.
What you will learn
Key facts before you start
Averages and range infographic
Before viewing
Before viewing, identify which average is being shown and what it tells you.
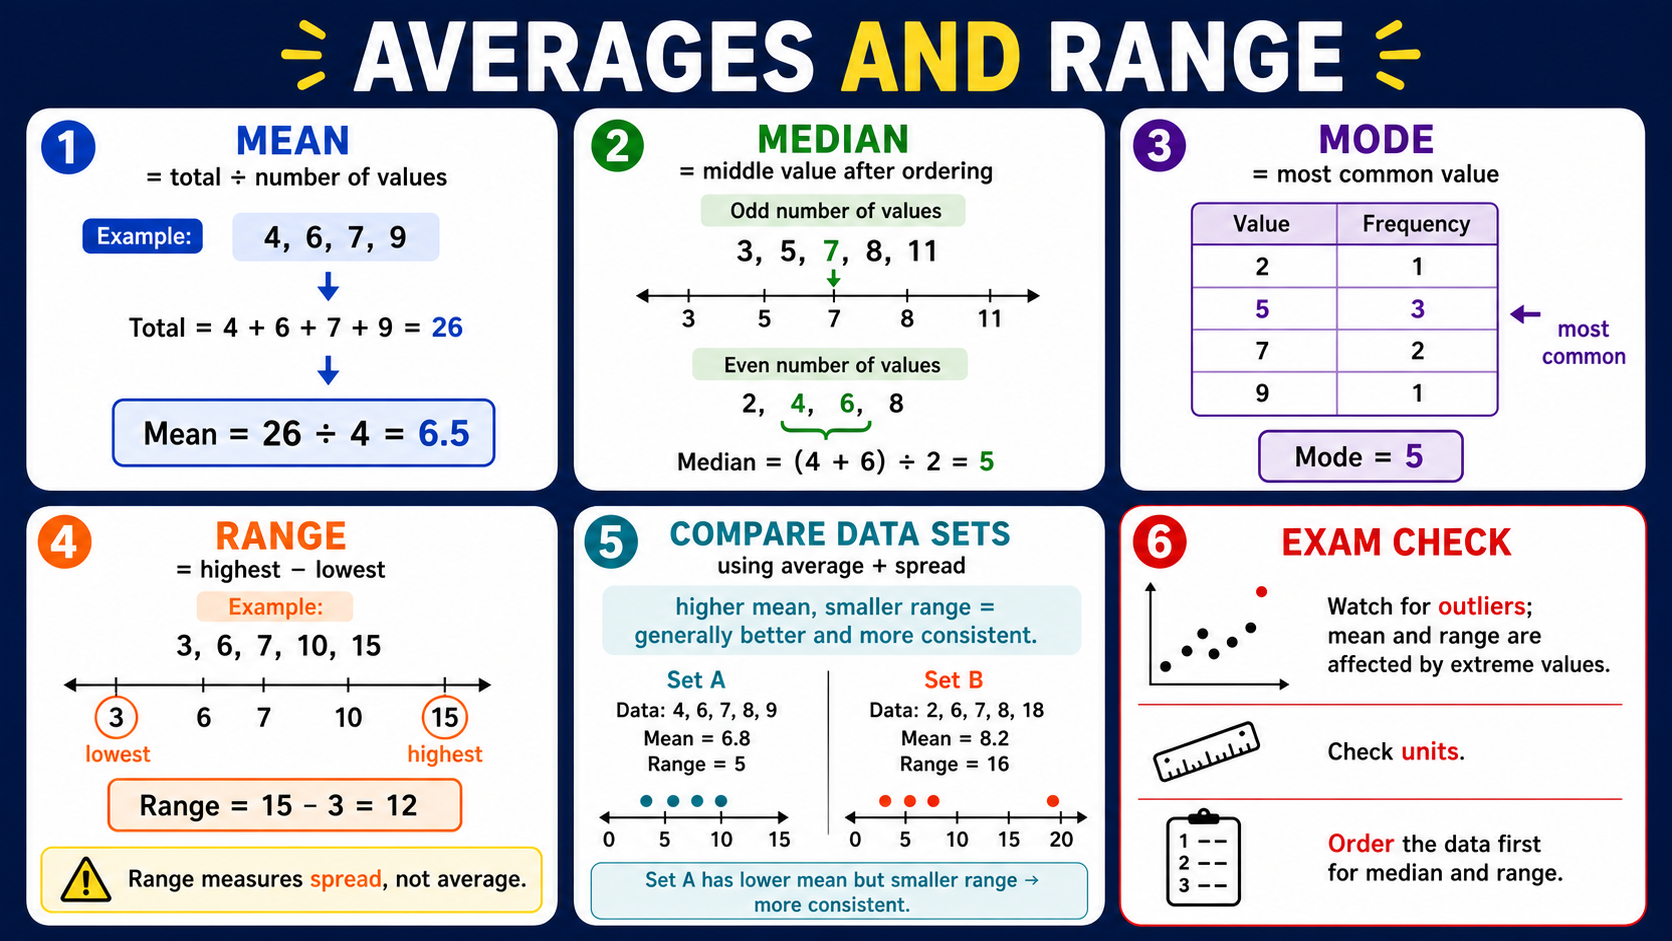
After viewing
After viewing, choose the best average for one data set and justify it.
Why this matters
Averages summarise data, but the range shows whether the data is tightly grouped or spread out.
Prior knowledge
You should already be comfortable with:
Clear explanation
Main idea
Mean = total ÷ number of values. Median is the middle value after ordering. Mode is the most common value. Range = highest − lowest.
Method
For a frequency table, multiply each value by its frequency to find the total, then divide by the total frequency. For grouped data, use class midpoints, so the mean is only an estimate.
For a missing value question, work backwards from total = mean × number of values. Subtract the known values from the required total to find what is missing.
A weighted mean is still total ÷ total number, but each group contributes value × frequency or value × weight. Do not average the row values unless all groups have the same frequency.
Outliers can pull the mean and range away from the main cluster of values. The median is often a better typical value when one unusually high or low value does not represent the group well.
Answer tip
When comparing two groups, mention both a typical value and the spread. For example: “Class A has a higher median and a smaller range, so its scores are generally higher and more consistent.”
Worked examples
Mean from a list
Find the mean of 4, 7, 9, 10.
Reveal answer
Answer: Total 30, so mean = 30 ÷ 4 = 7.5.
Median and range
Find the median and range of 3, 8, 4, 10, 5.
Reveal answer
Answer: Order 3, 4, 5, 8, 10. Median = 5 and range = 10 − 3 = 7.
Mean from a frequency table
Scores 1, 2, 3 have frequencies 4, 5, 1.
Reveal answer
Answer: Total score = 1 × 4 + 2 × 5 + 3 × 1 = 17. Total frequency = 10, so mean = 17 ÷ 10 = 1.7.
Weighted mean
Two tests have mean scores 12 from 20 pupils and 15 from 10 pupils. Find the overall mean.
Reveal answer
Answer: Total score = 12 × 20 + 15 × 10 = 390. Total pupils = 30, so overall mean = 390 ÷ 30 = 13.
Choosing an average with an outlier
House prices in a street are £160 000, £165 000, £170 000, £175 000 and £900 000. Which average best represents a typical house price?
Reveal answer
Answer: The median, £170 000, is better because the £900 000 outlier would pull the mean much higher than most of the values.
Quick checks
Choose an answer, then check your thinking.
1. Before finding the median, what must you do?
2. What should a comparison of two data sets usually mention?
Practice questions
Question 1
Four pupils scored 2, 6, 10 and 14 marks in a short quiz. Find the mean score.
Reveal answer and marking guidance
Answer: 8.
Marking: Total = 32 and 32 ÷ 4 = 8.
Question 2
A runner records five training distances: 9 km, 1 km, 4 km, 12 km and 7 km. Find the median distance, showing that the data must be ordered first.
Reveal answer and marking guidance
Answer: 7.
Marking: Order the values: 1, 4, 7, 9, 12, so the middle value is 7.
Question 3
The numbers of goals scored in five matches are 2, 3, 3, 5 and 9. Find the mode and the range.
Reveal answer and marking guidance
Answer: Mode = 3 and range = 7.
Marking: 3 appears most often, and 9 − 2 = 7.
Question 4
In a classroom quiz, scores of 1, 2 and 3 have frequencies 2, 4 and 4. Use frequency × score to find the mean score.
Reveal answer and marking guidance
Answer: 2.2.
Marking: Total score = 1 × 2 + 2 × 4 + 3 × 4 = 22. Total frequency = 10, so mean = 22 ÷ 10 = 2.2.
Question 5
The grouped table shows waiting times in minutes: 0 < t ≤ 10 has frequency 3, 10 < t ≤ 20 has frequency 5, and 20 < t ≤ 30 has frequency 2. Use class midpoints to estimate the mean waiting time.
Reveal answer and marking guidance
Answer: 14 minutes.
Marking: Use midpoints 5, 15 and 25. Estimated total = 5 × 3 + 15 × 5 + 25 × 2 = 140. Total frequency = 10, so estimated mean = 140 ÷ 10 = 14.
Question 6
Class A has median 68 and range 24. Class B has median 64 and range 10. Compare the two classes.
Reveal answer and marking guidance
Answer: Class A has the higher typical score, but Class B is more consistent.
Marking: Compare a typical value and a measure of spread: A has the higher median, while B has the smaller range.
Question 7
Five numbers have a mean of 12. Four of the numbers are 8, 10, 13 and 15. Find the missing number.
Reveal answer and marking guidance
Answer: 14.
Marking: Required total = 12 × 5 = 60. Known total = 8 + 10 + 13 + 15 = 46, so the missing number is 60 − 46 = 14.
Question 8
The ordered data set is 3, 6, 8, 11, 12, 14. Find the median and range.
Reveal answer and marking guidance
Answer: Median = 9.5 and range = 11.
Marking: There are six values, so average the two middle values: (8 + 11) ÷ 2 = 9.5. Range = 14 − 3 = 11.
Question 9
A group of 12 pupils has a mean score of 18. Another group of 8 pupils has a mean score of 23. Find the mean score for all 20 pupils.
Reveal answer and marking guidance
Answer: 20.
Marking: Total score = 12 × 18 + 8 × 23 = 400. Total pupils = 20, so the combined mean is 400 ÷ 20 = 20.
Question 10
The values are 6, 7, 7, 8, 9, 95. Give one reason why the median may be a better average than the mean.
Reveal answer and marking guidance
Answer: 95 is an outlier, so it pulls the mean up. The median, 7.5, is closer to the main group of values.
Marking: Identify the outlier and explain its effect on the mean, or calculate the median and compare it with the main cluster.
Answers and marking guidance
The exact practice answers are hidden under each question so you can try first. For averages and range, marks usually come from choosing the correct average, showing totals and divisions for the mean, ordering values for the median, and subtracting smallest from largest for the range. Comparison questions need a sentence about both typical value and spread, with units or context where relevant.
Common mistakes
- Finding the median before ordering: the middle value only counts after the data is in size order.
- Dividing by the wrong number: for a mean from a table, divide by the total frequency, not by the number of rows.
- Treating grouped estimates as exact: midpoint methods estimate because the exact raw values are unknown.
- Comparing only averages: if the question says compare distributions, include spread or consistency as well.
Extension challenge
Create two small data sets with the same mean but different ranges. Explain which set is more consistent and why.
Reveal answer
Example answer: Example data sets could be 4, 6, 8 and 1, 6, 11. Both have mean 6, but the first set has range 4 and is more consistent than the second set, which has range 10.
Exam-board guidance
Averages and Range appears across GCSE Maths Statistics. All boards expect accurate calculation, but higher-mark questions often ask pupils to interpret, estimate from grouped data or compare two distributions in words.
AQA GCSE Maths
Focus on the shared method, notation and checking habit; wording and context can vary by route.
OCR GCSE Maths
Show clear method steps and use precise notation; question wording may vary by route.
Pearson Edexcel GCSE Maths
Keep working visible and check units or notation; contexts may vary by route.
Eduqas GCSE Maths
Use the same core skill in practical contexts, with clear reasoning and final checks.
WJEC Wales
Connect the method to the context and state what the result means.
CCEA GCSE Maths
Make each method step visible and keep notation, units and final checks clear.
Next lesson
Next, continue with Tables, Charts and Diagrams.