
Lesson overview
Collecting and Classifying Data is part of GCSE Maths Statistics.
Plan fair samples, classify data and spot bias in questionnaires. Questions may ask you to name a data type, improve a survey method, explain bias or judge whether conclusions are reliable.
What you will learn
Key facts before you start
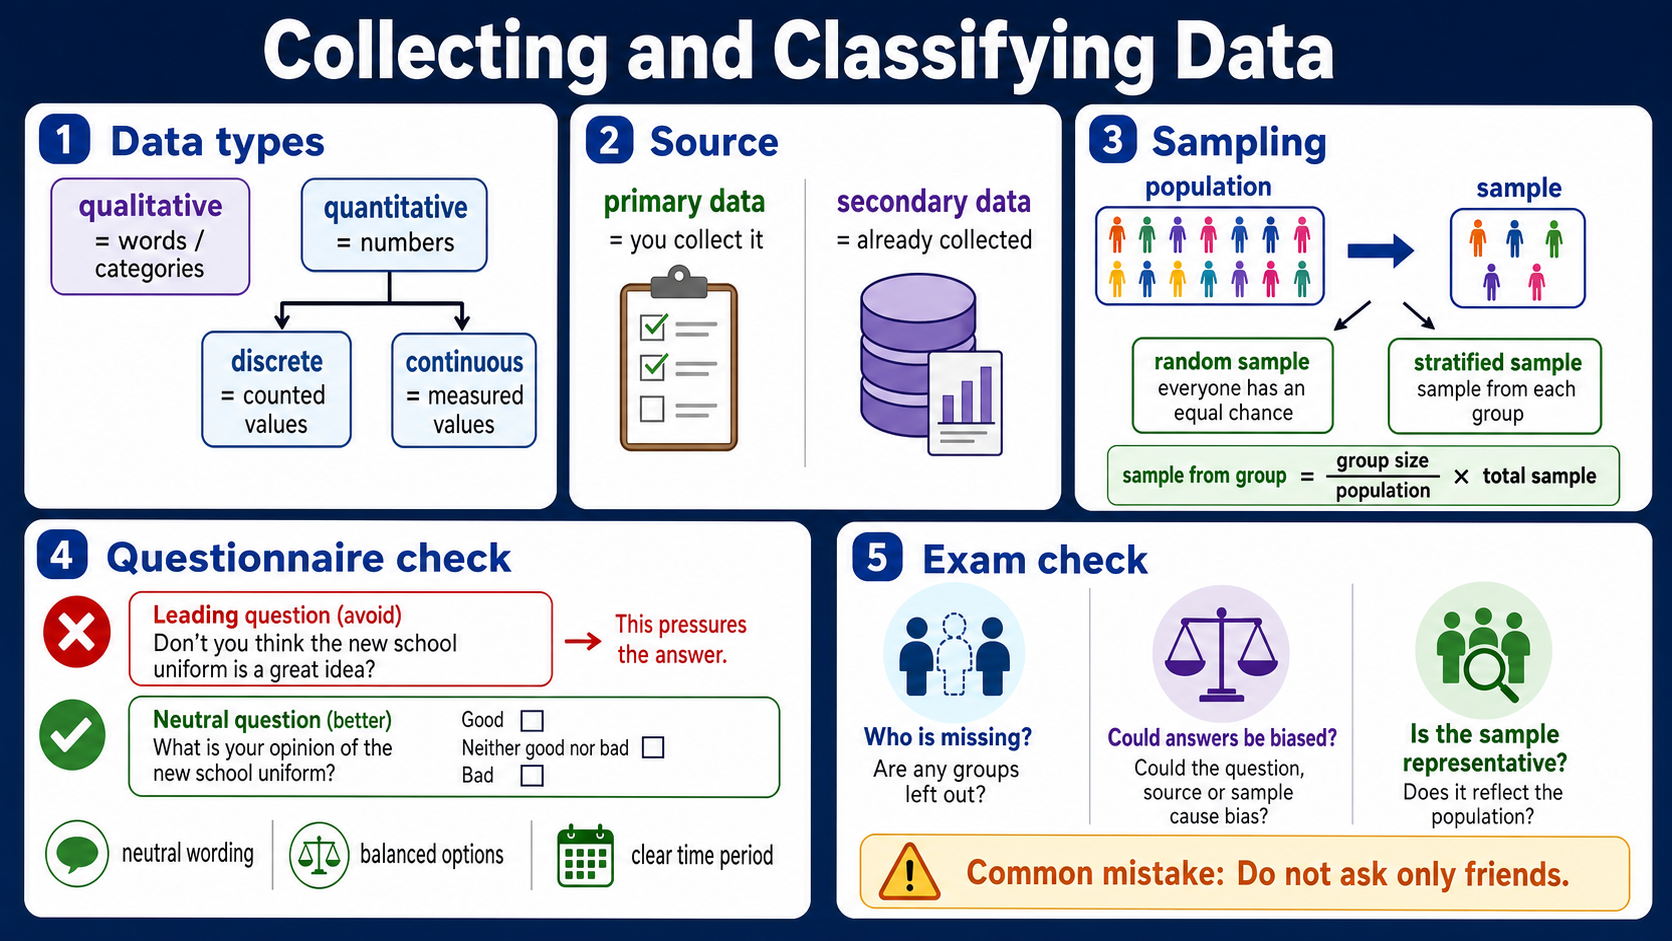
Collecting and classifying data infographic
Before viewing
Before viewing, identify the data type and whether the sample could be biased.
After viewing
After viewing, improve one survey question so it collects clearer data.
Why this matters
Statistics answers depend on good data. A biased question or poor sample can make every calculation misleading.
Prior knowledge
You should already be comfortable with:
Clear explanation
Main idea
Qualitative data uses categories, such as colour or transport method. Quantitative data uses numbers. Quantitative data can be discrete when it is counted, or continuous when it is measured.
Method
First identify the population: the whole group you want to know about. Then choose a sample that represents that group. Random or stratified samples are usually fairer than asking only convenient people.
Primary data is collected first-hand for the investigation. Secondary data already exists, such as published statistics. Either can be useful, but you still need to ask whether the data matches the question being investigated.
The sampling frame is the list or method used to reach people. If it misses part of the population, or if only the keenest people reply, the results may suffer from coverage bias or non-response bias.
Answer tip
For questionnaires, check whether the wording is leading, whether options overlap, whether response boxes cover every sensible answer and whether the sample is large enough.
For stratified sampling, keep each group in the same proportion as the population. Calculate group sample size = group size ÷ population size × total sample size, then round sensibly if the context requires whole people.
Worked examples
Classifying data
A survey records each pupil's journey time to school, measured in minutes.
Reveal answer
Answer: Journey time is quantitative and continuous because it is measured, even if the answers are rounded to whole minutes.
Questionnaire bias
“How much do you love our excellent school lunches?” is biased.
Reveal answer
Answer: It pushes the respondent towards a positive answer. A fairer question is “How would you rate the school lunches?” with balanced options.
Stratified sample size
A school has 900 pupils. Year 11 has 180 pupils. A stratified sample of 150 pupils is chosen.
Reveal answer
Answer: Year 11 should contribute 180 ÷ 900 × 150 = 30 pupils, so the sample keeps Year 11 in the same proportion as the school.
Quick checks
Choose an answer, then check your thinking.
1. Which data type describes number of siblings?
2. Which change best reduces questionnaire bias?
Practice questions
Question 1
A sports teacher records each pupil's time to run 100 m using a stopwatch. Classify this variable as discrete or continuous and give the reason.
Reveal answer and marking guidance
Answer: Continuous.
Marking: Time is measured, so it can take values between whole seconds.
Question 2
A survey asks pupils which type of phone they use: basic phone, smartphone or no phone. Classify this variable as qualitative or quantitative.
Reveal answer and marking guidance
Answer: Qualitative.
Marking: It is a category, not a numerical measurement.
Question 3
A headteacher wants to know whether lunchtime sport is popular across the whole school, but asks only pupils in the chess club. Name one problem with this sample.
Reveal answer and marking guidance
Answer: It is biased or unrepresentative.
Marking: The sample excludes many pupils who may have different views about sport.
Question 4
Rewrite this leading questionnaire item fairly: “Do you agree that the new timetable is much better?” Include the idea of balanced response options.
Reveal answer and marking guidance
Answer: A fair version is “What do you think of the new timetable?” with balanced response options.
Marking: Remove judgemental wording and give pupils positive, neutral and negative choices.
Question 5
A school has 1200 pupils. Year 10 has 300 pupils. A stratified sample of 200 pupils is chosen to represent every year group fairly. How many Year 10 pupils should be in the sample?
Reveal answer and marking guidance
Answer: 50 Year 10 pupils.
Marking: Year 10 is 300/1200 = 1/4 of the school, so 1/4 of 200 is 50.
Question 6
A questionnaire asks, “How many hours do you revise each week?” with boxes 0-5, 5-10 and 10-15. Name two problems with these response boxes.
Reveal answer and marking guidance
Answer: The boxes overlap at 5 and 10 hours, and there is no option for more than 15 hours.
Marking: Identify overlapping intervals and a missing response category. A fair set could use 0-5, more than 5-10, more than 10-15, more than 15.
Question 7
A council wants residents' views on a new bus route. It surveys 80 people at a bus stop at 8:30 am on a weekday. Give two reasons why this sample may be unreliable.
Reveal answer and marking guidance
Answer: It only includes people already using that bus stop, and it misses residents who travel at other times, use other routes or do not use buses.
Marking: Give contextual reasons linked to the population of all residents, not just a general statement that the sample is biased.
Question 8
A data set records each pupil's shoe size and whether they walk, cycle, get a bus or travel by car. Classify both variables.
Reveal answer and marking guidance
Answer: Shoe size is quantitative discrete data; method of travel is qualitative data.
Marking: Shoe size uses numbers from fixed values, while travel method is a category.
Question 9
A town has 18 000 adults. A researcher samples 120 adults from an online fitness forum to estimate how many adults exercise every day. Explain one problem and one improvement.
Reveal answer and marking guidance
Answer: The sample is biased because fitness-forum users are likely to exercise more than the whole adult population. A better method is to use a random or stratified sample of adults from across the town.
Marking: Link the bias to the context and suggest a method that can represent all adults, not just people already interested in fitness.
Question 10
A school emails a voluntary survey about homework to all parents. Only 46 out of 900 parents reply. Explain one possible problem with the data.
Reveal answer and marking guidance
Answer: The results may have non-response or volunteer bias because the small group who replied may feel more strongly about homework than the parents who did not reply.
Marking: Name the low response problem and explain why the respondents may not represent all parents.
Answers and marking guidance
The exact practice answers are hidden under each question so you can try first. For collecting and classifying data, marks usually come from naming the correct data type, identifying the population and sample, explaining bias clearly and suggesting a realistic improvement. In written answers, link your reason to the context instead of only writing “biased” or “unfair”.
Common mistakes
- Confusing counted and measured data: number of pupils is discrete, but height, time and mass are continuous even when rounded.
- Forgetting the population: a sample is only useful if it represents the whole group being studied.
- Calling every survey random: explain how people were selected, not just that the sample looks mixed.
- Spotting bias without fixing it: exam questions often want a fairer question, better answer boxes or a more representative sample.
Extension challenge
Design a short questionnaire to investigate how pupils travel to school. Include the population, sampling method, two fair questions and one sentence explaining how you avoided bias.
Reveal answer
Example answer: A good questionnaire names the population, uses a realistic sampling method, asks neutral questions such as “How do you usually travel to school?” and avoids leading wording like “Do you agree walking is best?”
Exam-board guidance
Collecting and Classifying Data appears across GCSE Maths Statistics. Exact wording varies, but all boards expect pupils to recognise data types, judge sampling methods and explain why biased data collection gives unreliable conclusions.
AQA GCSE Maths
Focus on the shared method, notation and checking habit; wording and context can vary by route.
OCR GCSE Maths
Show clear method steps and use precise notation; question wording may vary by route.
Pearson Edexcel GCSE Maths
Keep working visible and check units or notation; contexts may vary by route.
Eduqas GCSE Maths
Use the same core skill in practical contexts, with clear reasoning and final checks.
WJEC Wales
Connect the method to the context and state what the result means.
CCEA GCSE Maths
Make each method step visible and keep notation, units and final checks clear.
Next lesson
Next, continue with Averages and Range.