
Lesson overview
Frequency Trees and Two-Way Tables is part of GCSE Maths Probability.
Frequency trees and two-way tables organise grouped counts so missing values, totals and probabilities can be found without losing track of the categories.
What you will learn
Key facts before you start
Why this matters
These diagrams appear often because they test organisation as much as probability.
Prior knowledge
You should already be comfortable with:
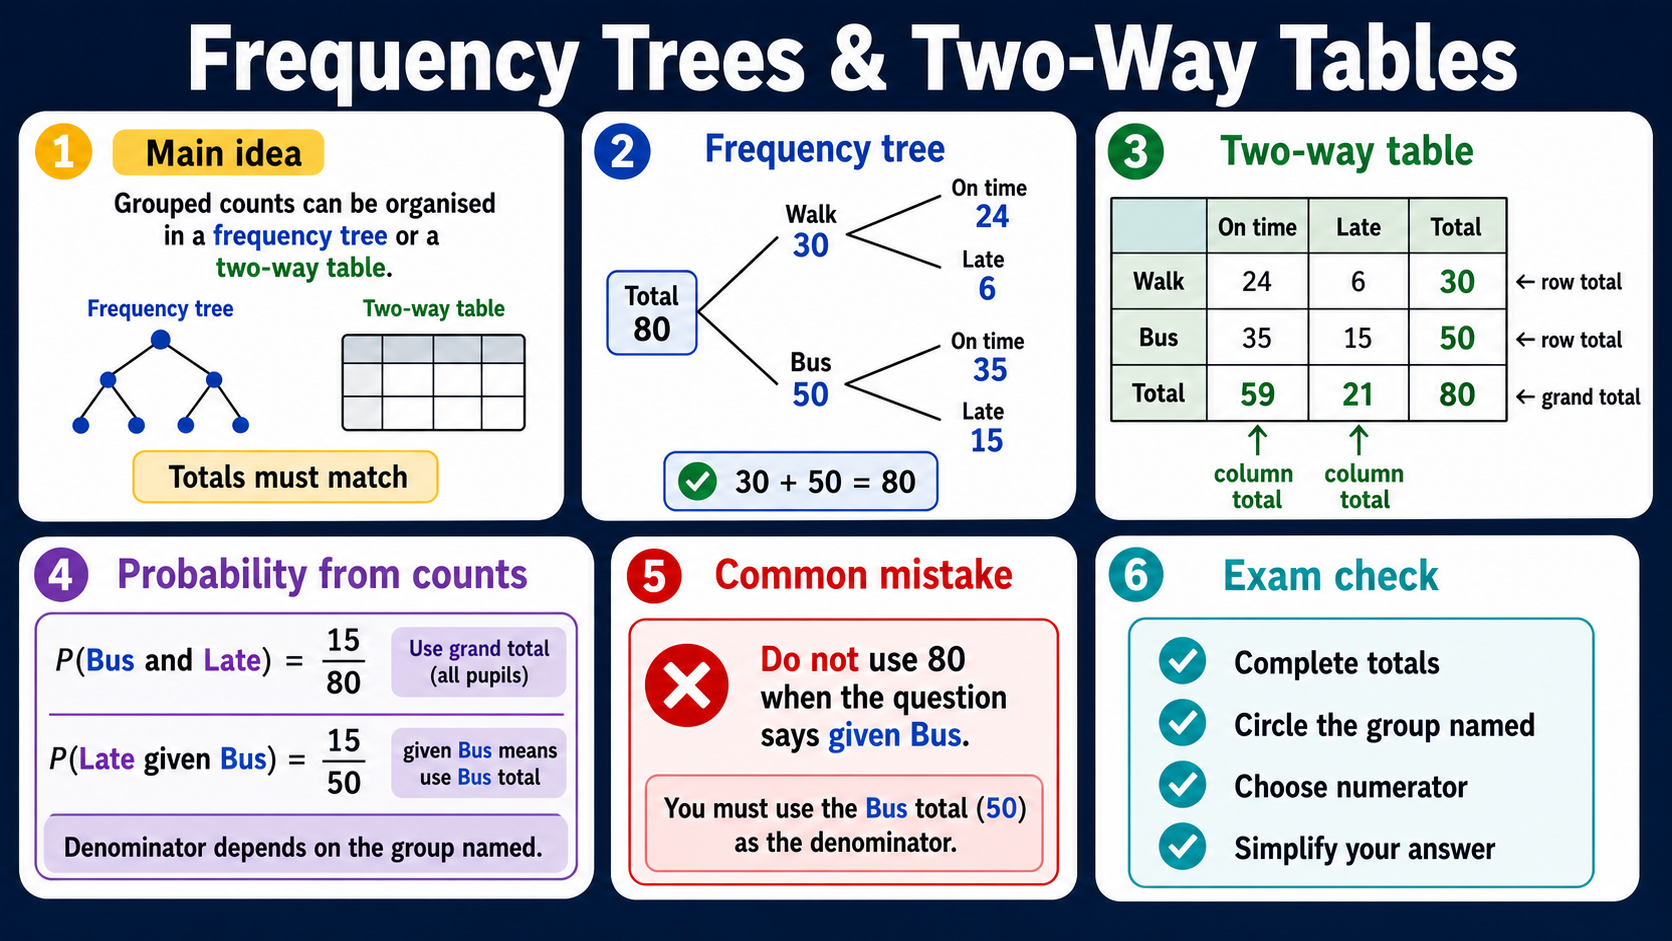
Frequency trees and two-way tables infographic
Before viewing
Before viewing, identify the total and one missing branch or cell.
After viewing
After viewing, complete one missing table entry and write a probability from the table.
Clear explanation
Main idea
A frequency tree splits a total into categories, then splits those categories again. A two-way table shows the same kind of information in rows and columns. In both formats, totals are the main checks.
Method
Complete the missing values before answering the probability question. If the wording says given that, restrict the numerator and denominator to the named group rather than using the overall total.
Use both directions as checks: row entries should add to row totals, column entries should add to column totals, and the bottom-right grand total should match the original total.
When entries are algebraic, use the row or column total to form an equation first. Once the missing value is found, return to the probability wording and choose the correct count-over-total fraction.
For comparison questions, use equivalent fractions, decimals or percentages only after the correct subgroup totals have been chosen. A percentage from a row and a percentage from the whole table are not the same denominator.
When the question gives one category first, such as chosen from the pupils who attend Saturday club, build that restricted total before deciding which part of it matches the second category.
Answer tip
Circle the group the question is asking about. Overall probabilities use the grand total; conditional probabilities use a row, column or branch total.
Worked examples
Two-way table
In a group of 40, 18 are girls and 12 pupils wear glasses. If 5 girls wear glasses, how many boys wear glasses?
Reveal answer
Answer: 12 − 5 = 7 boys wear glasses.
Conditional probability from a row
In the table above, find the probability that a pupil wears glasses, given that they travel by bus.
Reveal answer
Answer: Use only the bus row: 12/30 = 2/5.
Comparing subgroups
In a survey, 9 out of 30 Year 10 pupils and 14 out of 40 Year 11 pupils choose art. Which year group has the greater proportion choosing art?
Reveal answer
Answer: Year 10: 9/30 = 30%. Year 11: 14/40 = 35%. Year 11 has the greater proportion choosing art.
Quick checks
Choose an answer, then check your thinking.
1. A total of 70 splits into 26 yes and the rest no. How many no?
2. The wording says given that the pupil is in Year 10. Which denominator should you use?
Practice questions
Question 1
A school survey records 60 pupils. In a frequency tree, 24 pupils answer yes and the rest answer no. Complete the no branch.
Reveal answer and marking guidance
Answer: 36.
Marking: 60 − 24 = 36.
Question 2
In a two-way table for 50 pupils, 22 are girls and 8 of the girls cycle. If 15 pupils cycle in total, complete the boys-cycle cell.
Reveal answer and marking guidance
Answer: 7.
Marking: Total cyclists − girl cyclists = 15 − 8 = 7.
Question 3
A completed table shows 9 pupils in the drama-and-bus category out of 30 pupils in total. What is the probability of choosing a pupil from that category?
Reveal answer and marking guidance
Answer: 3/10.
Marking: 9/30 simplifies to 3/10.
Question 4
A table has 14 Year 10 pupils who walk and 35 Year 10 pupils in total. Find P(walk | Year 10).
Reveal answer and marking guidance
Answer: 2/5.
Marking: Given Year 10 means use 35 as the denominator: 14/35 = 2/5.
Question 5
A two-way table has 18 pupils who prefer maths, 12 pupils who prefer English and 30 pupils in total. Of the 16 Year 11 pupils, 10 prefer maths. Find P(English | Year 11).
Reveal answer and marking guidance
Answer: 3/8.
Marking: Year 11 English is 16 − 10 = 6, so P(English | Year 11) = 6/16 = 3/8.
Question 6
A frequency tree starts with 90 people. 54 are members and 36 are not members. Of the members, 20 are under 18. Of the non-members, 15 are under 18. Find the probability that a person chosen at random is 18 or over.
Reveal answer and marking guidance
Answer: 11/18.
Marking: Under 18 total is 20 + 15 = 35, so 18 or over is 90 − 35 = 55. The probability is 55/90 = 11/18.
Question 7
In a two-way table, the row entries are x, 18 and total 42. Find x, then find the probability of choosing someone from the x category out of 84 people overall.
Reveal answer and marking guidance
Answer: x = 24 and the probability is 2/7.
Marking: Use the row total first: x + 18 = 42, so x = 24. Then use the overall total: 24/84 = 2/7.
Question 8
A frequency tree has 120 pupils. 72 study Spanish and 48 do not. Of the Spanish pupils, 45 also study art. Of the non-Spanish pupils, 18 study art. Find P(Spanish | art).
Reveal answer and marking guidance
Answer: 5/7.
Marking: The art total is 45 + 18 = 63. Given art means use 63 as the denominator, so P(Spanish | art) = 45/63 = 5/7.
Question 9
In a club, 18 out of 45 juniors and 24 out of 60 seniors attend on Saturday. Which group has the higher attendance rate?
Reveal answer and marking guidance
Answer: The rates are equal.
Marking: Juniors: 18/45 = 2/5 = 40%. Seniors: 24/60 = 2/5 = 40%, so neither group is higher.
Question 10
A two-way table has 36 pupils who attend drama and 44 who do not. Of the 50 pupils who attend the school concert, 28 attend drama. Given that a pupil attends drama, find the probability that the pupil also attends the concert.
Reveal answer and marking guidance
Answer: 7/9.
Marking: Given drama means the denominator is 36 drama pupils. The concert-and-drama count is 28, so P(concert | drama) = 28/36 = 7/9.
Answers and marking guidance
The exact practice answers are hidden under each question so you can try first. For frequency trees and two-way tables, marks usually come from completing missing values accurately, showing add/subtract checks for totals, choosing the correct denominator, comparing rates fairly and recognising conditional wording such as given that.
Common mistakes
- Leaving the table incomplete: fill the missing cells before calculating probabilities.
- Ignoring row and column checks: both directions should add to the same grand total.
- Using the overall total for given-that questions: conditional wording needs the total for the named group.
- Mixing categories: keep labels such as bus/not bus and glasses/no glasses attached to the right branch or cell.
Extension challenge
Start with 80 pupils. Say 46 study Spanish, 38 study French and 21 study both. Complete a two-way table, then use a frequency tree to show the same information.
Reveal answer
Example answer: Spanish and French = 21, Spanish only = 25, French only = 17, neither = 17. The tree should split first by Spanish, then by French, with branch totals matching 80.
Exam-board guidance
Frequency Trees and Two-Way Tables appears within shared GCSE probability and data-handling content. Board questions differ in wording, but all expect careful use of row totals, column totals, grand totals and named subgroups.
AQA GCSE Maths
Focus on the shared method, notation and checking habit; wording and context can vary by route.
OCR GCSE Maths
Show clear method steps and use precise notation; question wording may vary by route.
Pearson Edexcel GCSE Maths
Keep working visible and check units or notation; contexts may vary by route.
Eduqas GCSE Maths
Use the same core skill in practical contexts, with clear reasoning and final checks.
WJEC Wales
Connect the method to the context and state what the result means.
CCEA GCSE Maths
Make each method step visible and keep notation, units and final checks clear.
Next lesson
Next, continue with Probability Trees.