
Lesson overview
Probability Language and Scales is part of GCSE Maths Probability.
Use probability words, fractions, decimals and percentages on the 0 to 1 scale. Questions may ask for direct calculation, interpretation, explanation or clear method in context.
What you will learn
Key facts before you start
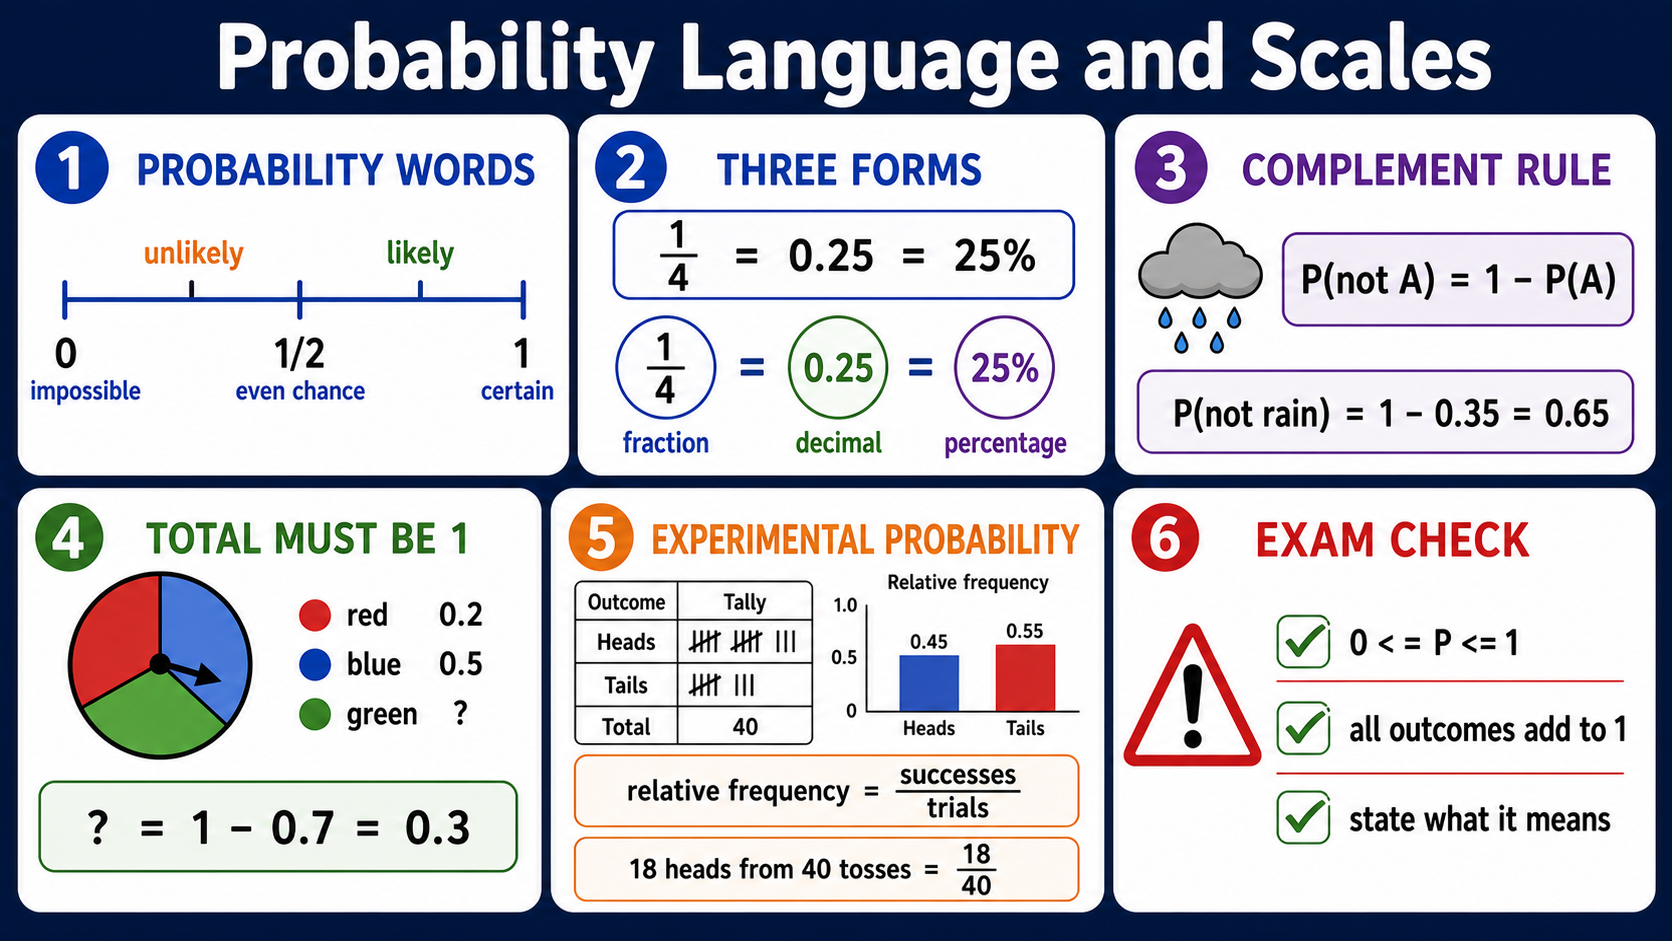
Probability language and scales infographic
Before viewing
Before viewing, place impossible, even chance and certain on the probability scale.
After viewing
After viewing, convert one probability into its complement.
Why this matters
This language appears in every probability topic, from spinner questions to tree diagrams.
Prior knowledge
You should already be comfortable with:
Clear explanation
Main idea
A probability of 0 means impossible and 1 means certain. An even chance is 0.5, 1/2 or 50%. Values closer to 1 are more likely; values closer to 0 are less likely.
Method
Probabilities can be fractions, decimals or percentages, but they must represent the same amount. All probabilities for a complete set of outcomes add to 1. Relative frequency estimates probability from repeated trials: number of times the event happened divided by total trials.
Answer tip
Use the complement rule for “not” questions: P(not A) = 1 − P(A). Never give a probability below 0 or above 1. For expected outcomes, multiply the probability by the number of trials and check that the result is sensible in context.
Worked examples
Missing probability
A bag gives P(red)=0.35 and P(blue)=0.45. Find P(green).
Reveal answer
Answer: 1 − 0.35 − 0.45 = 0.20.
Equivalent forms
Place 3/5 on the probability scale and write it as a decimal and percentage.
Reveal answer
Answer: 3/5 = 0.6 = 60%, so it sits just to the right of even chance and is more likely than not.
Expected outcomes
A spinner has probability 0.15 of landing on blue. Estimate the number of blue results in 400 spins.
Reveal answer
Answer: 0.15 × 400 = 60, so expect about 60 blue results.
Quick checks
Choose an answer, then check your thinking.
1. What is P(not rain) if P(rain) = 0.35?
2. Which value cannot be a probability?
Practice questions
Question 1
What probability means certain?
Reveal answer and marking guidance
Answer: 1.
Marking: Certain events always happen.
Question 2
Convert 0.25 to a fraction.
Reveal answer and marking guidance
Answer: 1/4.
Marking: 0.25 = 25/100 = 1/4.
Question 3
If P(win)=0.3, find P(not win).
Reveal answer and marking guidance
Answer: 0.7.
Marking: Complement is 1 − 0.3.
Question 4
Can a probability be 1.2?
Reveal answer and marking guidance
Answer: No.
Marking: Probabilities must be between 0 and 1.
Question 5
A spinner has probabilities 0.18 for red, 0.27 for blue and 0.35 for green. The only other colour is yellow. Find P(yellow).
Reveal answer and marking guidance
Answer: 0.20.
Marking: Exhaustive probabilities add to 1, so P(yellow) = 1 − 0.18 − 0.27 − 0.35 = 0.20.
Question 6
A football team wins 18 of its next 30 similar matches in a simulation. Use this to estimate the probability of a win as a fraction, decimal and percentage.
Reveal answer and marking guidance
Answer: 3/5, 0.6 and 60%.
Marking: Relative frequency is 18/30 = 3/5 = 0.6 = 60%.
Question 7
A biased coin is tossed 200 times. It lands heads 86 times. Estimate P(tails) from this experiment.
Reveal answer and marking guidance
Answer: 114/200 = 57/100 = 0.57.
Marking: Tails occurred 200 − 86 = 114 times, so the relative frequency is 114/200, which simplifies to 57/100.
Question 8
A game has probability 0.35 of a prize on each play. Estimate how many prizes you would expect in 240 plays.
Reveal answer and marking guidance
Answer: 84 prizes.
Marking: Expected number = 0.35 × 240 = 84.
Question 9
A box contains red, blue and green counters. P(red)=0.28 and P(blue)=0.46. Find P(green), then describe the event using probability language.
Reveal answer and marking guidance
Answer: P(green)=0.26, so green is unlikely but still possible.
Marking: Use exhaustive probabilities: 1 − 0.28 − 0.46 = 0.26. Since 0.26 is below 0.5 but above 0, unlikely is a sensible description.
Question 10
A spinner landed on purple 72 times in 300 spins. Estimate P(purple), then estimate the number of purple results in 500 similar spins.
Reveal answer and marking guidance
Answer: P(purple) = 72/300 = 0.24, so expect about 120 purple results in 500 spins.
Marking: Use relative frequency first, then multiply by the new number of trials: 0.24 × 500 = 120.
Answers and marking guidance
The exact practice answers are hidden under each question so you can try first. For probability language and scales, marks usually come from using the 0 to 1 scale correctly, converting between equivalent forms, applying complements, checking that exhaustive outcomes add to 1, and showing relative-frequency or expected-outcome working with the correct number of trials.
Common mistakes
- Giving impossible probabilities: values below 0 or above 1 are not valid probabilities.
- Mixing forms carelessly: 0.25, 1/4 and 25% are equivalent, but 0.25% is not the same thing.
- Forgetting the complement: if an event and its opposite are the only options, their probabilities add to 1.
- Using vague words alone: when the question asks for a probability, support words like likely or unlikely with a number.
Extension challenge
Put impossible, unlikely, even chance, likely and certain onto a 0 to 1 probability scale. Add one fraction, decimal and percentage example to three of the positions.
Reveal answer
Example answer: Impossible = 0, even chance = 1/2 = 0.5 = 50%, certain = 1 = 100%. Unlikely should be between 0 and 0.5; likely should be between 0.5 and 1.
Exam-board guidance
Probability Language and Scales appears across Core and extension practice GCSE Maths. Exact contexts vary, but the core skills are stable: use probability vocabulary accurately, place values on the 0 to 1 scale, check complements or missing probabilities, and link experimental evidence to later relative-frequency work.
AQA GCSE Maths
Focus on the shared method, notation and checking habit; wording and context can vary by route.
OCR GCSE Maths
Show clear method steps and use precise notation; question wording may vary by route.
Pearson Edexcel GCSE Maths
Keep working visible and check units or notation; contexts may vary by route.
Eduqas GCSE Maths
Use the same core skill in practical contexts, with clear reasoning and final checks.
WJEC Wales
Connect the method to the context and state what the result means.
CCEA GCSE Maths
Make each method step visible and keep notation, units and final checks clear.
Next lesson
Next, continue with Listing Outcomes and Sample Space Diagrams.