
Lesson overview
A practical rates skill for graphs, journeys, pay, filling and comparison.
A rate of change describes how quickly one quantity changes compared with another. In GCSE questions, that often means reading units carefully, finding an average rate, or interpreting a graph gradient in context.
What you will learn
Key facts before you start
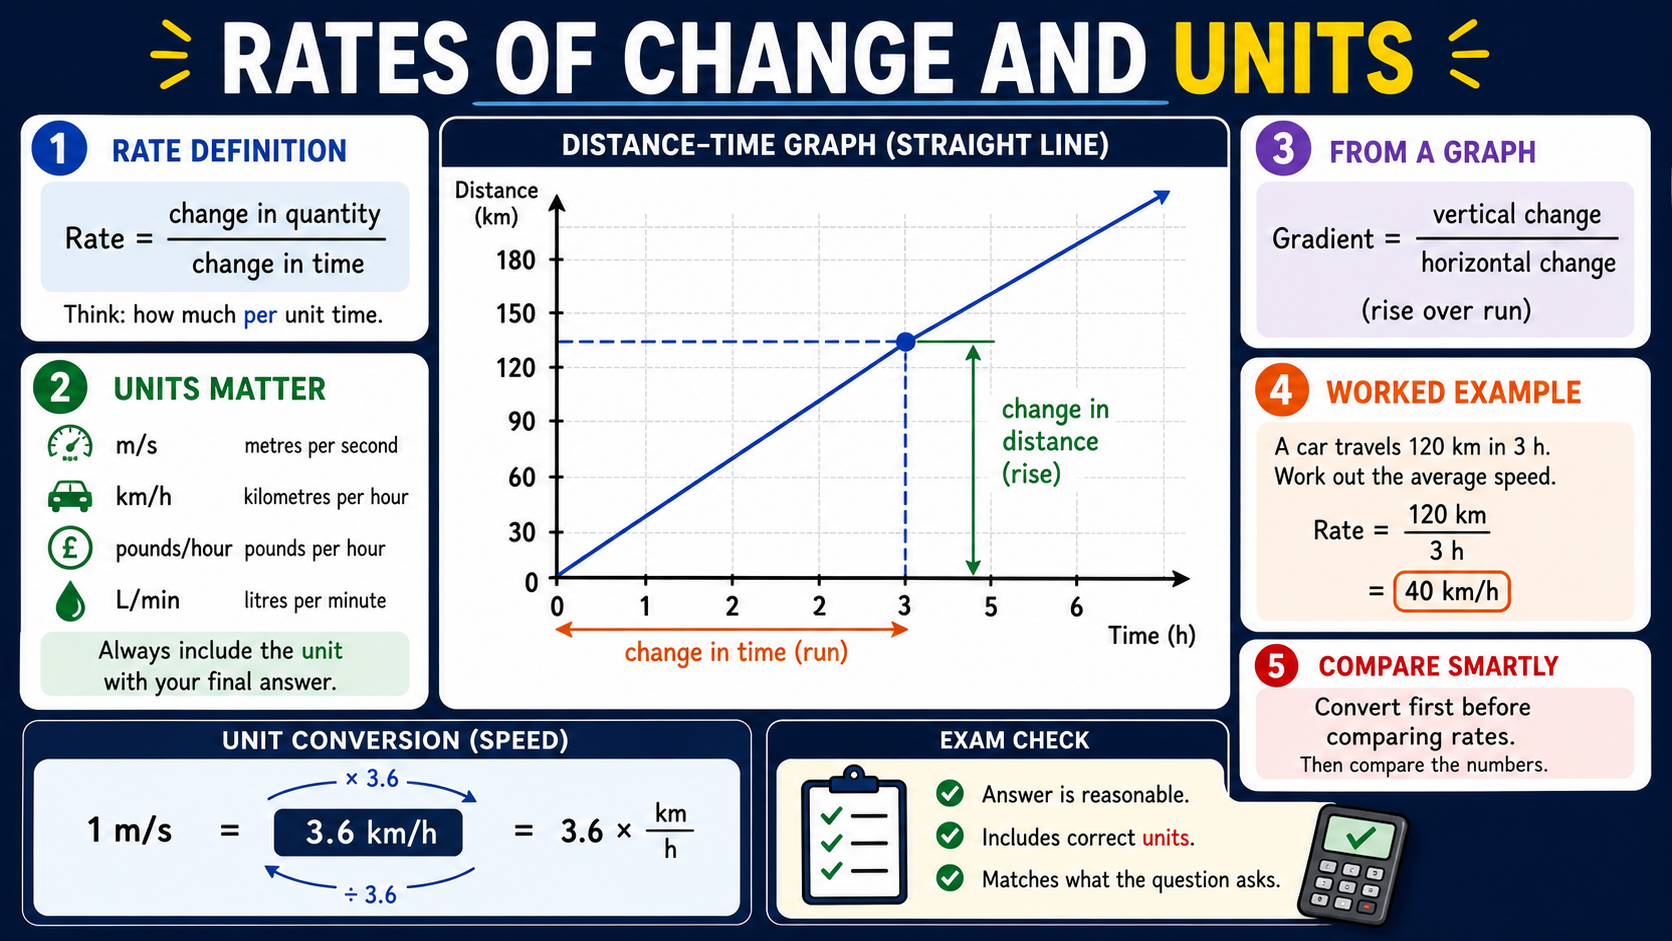
Rates of change and units infographic
Before viewing
Before viewing, identify the two quantities used to form the rate.
After viewing
After viewing, calculate one gradient and write its units.
Why this matters
Rates of change appear whenever something changes over distance, time, cost, volume or another measure. Speed tells you how distance changes with time. Pay rate tells you how money changes with hours worked.
The number is only half the answer. The unit tells you what is being compared, so 12 m/s, £12/hour and 12 litres/min all mean very different things.
Prior knowledge
You should already be comfortable with:
Clear explanation
What a rate of change means
A rate of change compares a change in one quantity with a change in another. It answers a question like “how much per second?”, “how far per hour?” or “how many litres per minute?”.
Per notation
The slash in a unit is read as “per”. For example, km/h means kilometres per hour, m/s means metres per second, £/hour means pounds per hour, and litres/min means litres per minute.
If a pump fills 45 litres in 3 minutes, the rate is 45 ÷ 3 = 15 litres/min. That means 15 litres are added each minute on average.
Average rate of change
An average rate uses the total change over the whole interval. It does not say the rate was exactly the same at every moment.
A tank contains 20 litres at 2 pm and 80 litres at 5 pm. change in volume = 80 − 20 = 60 litres change in time = 3 hours average rate = 60 ÷ 3 = 20 litres/hourGraph gradients in context
On a graph, the gradient of a straight line is a rate of change. Use the axis labels to decide the units.
The graph shows distance changing by 80 m while time changes by 10 s, so the gradient is 80 ÷ 10 = 8 m/s. In this context, the gradient means speed.
If the line does not start at zero, still use the change between two points. The gradient is about the change, not the starting value or the final value.
Converting units
Convert units when the question needs a different form or when two rates must be compared fairly.
72 km/h = 72 000 m/hour 1 hour = 3600 seconds 72 000 ÷ 3600 = 20 m/sAlways convert both parts of the unit if needed. Changing km/h to m/s means converting kilometres to metres and hours to seconds.
When comparing two rates, change them to the same unit first. A value in m/s can be compared with another value in m/s; a value in km/h should not be compared directly with m/s.
Worked examples
Example 1: Average speed
A cyclist travels 18 km in 1.5 hours. Find the average speed.
average speed = distance ÷ time average speed = 18 ÷ 1.5 = 12Reveal answer
Answer: 12 km/h.
Example 2: A pay rate
Sam earns £54 for 6 hours of work. Find the rate of pay.
rate of pay = money ÷ time rate of pay = £54 ÷ 6 = £9Reveal answer
Answer: £9/hour.
Example 3: Gradient of a distance-time graph
A straight line on a distance-time graph goes from 20 m at 4 s to 68 m at 10 s. Find the speed shown by the line.
change in distance = 68 − 20 = 48 m change in time = 10 − 4 = 6 s gradient = 48 ÷ 6 = 8Reveal answer
Answer: 8 m/s.
Example 4: Convert before comparing
Machine A fills 2.4 litres in 30 seconds. Machine B fills 5 litres in 1 minute. Which has the greater flow rate?
Machine A: 2.4 litres in 30 seconds = 4.8 litres/min Machine B: 5 litres/minReveal answer
Answer: Machine B has the greater flow rate.
Example 5: A conversion graph gradient
A straight-line conversion graph has pounds (£) on the vertical axis and dollars ($) on the horizontal axis. It passes through (20, 16) and (50, 40). Find the gradient and explain it.
change in pounds = 40 − 16 = 24 change in dollars = 50 − 20 = 30 gradient = 24 ÷ 30 = 0.8Reveal answer
Answer: £0.80 per $1, so each dollar is worth 80 pence on this graph.
Quick checks
Choose an answer, then check your thinking.
1. A tap fills 36 litres in 4 minutes. What is the average rate?
2. A graph shows cost (£) against hours. What does the gradient represent?
3. Which rate is equal to 36 km/h?
Practice questions
Question 1
A car travels 96 km in 2 hours. Find its average speed in km/h.
Reveal answer and marking guidance
Answer: 48 km/h.
Marking: average speed = distance ÷ time = 96 ÷ 2 = 48.
Question 2
A machine makes 150 labels in 5 minutes. Find the production rate in labels per minute.
Reveal answer and marking guidance
Answer: 30 labels per minute.
Marking: rate = 150 ÷ 5 = 30 labels per minute.
Question 3
A tank contains 15 litres at 10:00 and 75 litres at 10:12. Find the average rate of filling.
Reveal answer and marking guidance
Answer: 5 litres/min.
Marking: change in volume = 75 − 15 = 60 litres; change in time = 12 minutes; rate = 60 ÷ 12 = 5 litres/min.
Question 4
A straight line on a graph of cost (£) against time (hours) goes from (2, 18) to (7, 63). Find the gradient and explain its meaning.
Reveal answer and marking guidance
Answer: £9/hour, meaning the cost increases by £9 each hour.
Marking: change in cost = 63 − 18 = 45; change in time = 7 − 2 = 5; gradient = 45 ÷ 5 = 9. The gradient unit is vertical divided by horizontal, so £/hour.
Question 5
Convert 54 km/h into m/s.
Reveal answer and marking guidance
Answer: 15 m/s.
Marking: 54 km = 54 000 m and 1 hour = 3600 seconds, so 54 000 ÷ 3600 = 15.
Question 6
A pump fills 3 litres in 20 seconds. Find its rate in litres/min.
Reveal answer and marking guidance
Answer: 9 litres/min.
Marking: 20 seconds is one third of a minute, so 3 × 3 = 9 litres in 1 minute.
Question 7
A graph of volume (ml) against time (s) goes from (10, 200) to (50, 1000). Find the average filling rate in litres/min.
Reveal answer and marking guidance
Answer: 1.2 litres/min.
Marking: change in volume = 1000 − 200 = 800 ml and change in time = 50 − 10 = 40 s. Rate = 800 ÷ 40 = 20 ml/s = 1200 ml/min = 1.2 litres/min.
Question 8
Runner A runs 100 m in 12.5 seconds. Runner B runs at 27 km/h. Who has the greater speed?
Reveal answer and marking guidance
Answer: Runner A.
Marking: Runner A: 100 ÷ 12.5 = 8 m/s. Runner B: 27 km/h = 27 000 ÷ 3600 = 7.5 m/s. Runner A is faster.
Question 9
A cyclist travels 4.8 km in 16 minutes. Find the average speed in m/s and in km/h.
Reveal answer and marking guidance
Answer: 5 m/s and 18 km/h.
Marking: Convert 4.8 km to 4800 m and 16 minutes to 960 seconds, then 4800 ÷ 960 = 5 m/s. For km/h, 16 minutes is 16/60 hours, so 4.8 ÷ (16/60) = 18 km/h.
Question 10
A straight line on a graph of volume (litres) against time (seconds) goes from (15, 4.5) to (75, 16.5). Find the filling rate in litres/min.
Reveal answer and marking guidance
Answer: 12 litres/min.
Marking: Change in volume = 16.5 − 4.5 = 12 litres. Change in time = 75 − 15 = 60 seconds = 1 minute, so the rate is 12 ÷ 1 = 12 litres/min.
Answers and marking guidance
The exact practice answers are hidden under each question so you can try first. For rates of change, marks usually come from comparing change in one quantity with change in another, keeping the “per” unit clear, converting units before comparing, and recognising that a graph gradient is a rate. When a question asks for a decision, finish with a sentence that uses the converted rates.
Common mistakes
- Forgetting the unit: a rate needs both quantities, such as m/s or litres/min.
- Using total values instead of changes: average rate uses the difference between the two values.
- Reading graph axes in the wrong order: gradient units come from vertical-axis units divided by horizontal-axis units.
- Comparing rates with different units: convert first, then compare.
- Assuming average means constant: an average rate describes the whole interval, not every instant.
Extension challenge
A graph of volume (litres) against time (minutes) is a straight line. It passes through (4, 18) and (10, 63). Find the gradient and explain what it means.
Reveal answer
Answer: 7.5 litres/min.
change in volume = 63 − 18 = 45 litres. Change in time = 10 − 4 = 6 minutes. Gradient = 45 ÷ 6 = 7.5, so the volume increases by 7.5 litres each minute.
Exam-board guidance
Rates of change are common across GCSE Maths. Expect questions involving practical rates, graph gradients, compound units, average rates, unit conversion and explaining what the rate means.
AQA GCSE Maths
Focus on the shared method, notation and checking habit; wording and context can vary by route.
OCR GCSE Maths
Show clear method steps and use precise notation; question wording may vary by route.
Pearson Edexcel GCSE Maths
Keep working visible and check units or notation; contexts may vary by route.
Eduqas GCSE Maths
Use the same core skill in practical contexts, with clear reasoning and final checks.
WJEC Wales
Connect the method to the context and state what the result means.
CCEA GCSE Maths
Make each method step visible and keep notation, units and final checks clear.
Next lesson
Next, build on repeated rates with Growth, Decay and Iteration Problems.